Gaby Hinsliff argues that British seaside towns excel at: surprises. They’re all about the unexpected, the quirky, even the subversive; places for mooching around and stumbling across things, boasting a certain indomitable spirit born of constantly having to think of stuff to do in the rain. And that makes them natural wellsprings of creativity.
A couple dance on top of a bus shelter to the music of a nearby accordion player. Children play in a boat, on a wall in a Lowestoft park. And by the beach huts in Cromer, a hermit crab with a placard reading, “Luxury rentals only” guards a pile of empty whelk shells from a huddle of homeless crabs.
A string of artworks that may or may not be by the pseudonymous graffiti artist Banksy have been discovered scattered along the East Anglian coast, raising the tantalising prospect that like everyone else who couldn’t get abroad this summer, he just went to Norfolk and hung around in bus shelters instead. “Is Banksy in Great Yarmouth?” ran the dream August headline, after a miniature cottage with his name sprayed on one side and “Go big or go home” on another was mysteriously added overnight to the resort’s Merrivale model village. Maybe it’s real, and maybe it isn’t, but it’s absolutely the sort of thing the British seaside is for.
Coastal towns get a miserable rap. Regardless of all that bracing sea air, they’re notorious hotbeds of poor health and low life expectancy (England’s chief medical officer, Prof Chris Whitty, is making tackling health inequalities in impoverished seaside towns a priority, post-Covid) and lagging educational performance. I last went to Yarmouth on the eve of lockdown, to see a school serving a deeply deprived neighbourhood that had been transformed from chaotic to thriving; but the kids still needed more decent local jobs to move into. And while some coastal towns are struggling with the loss of both a once booming industry – fishing in Lowestoft or Grimsby, bucket-and-spade tourism in Skegness or Scarborough – for others, it’s prosperity itself that is the problem.
“Don’t feed the locals; they bite,” read the handwritten sign by a pretty Cornish cove this summer, where holidaymakers were spreading towels around fishing boats drawn up on the shingle. A joke, though only just; second homers and wealthy retirees have long monopolised the prettier bits of Devon and Cornwall, and this year’s holiday feeding frenzy saw reports of landlords evicting long-term local tenants in order to cash in on renting to tourists via Airbnb. A post-Covid exodus of Londoners realising that remote working allows them to earn a city wage from the seaside, meanwhile, risks breeding resentment among priced-out locals along the Kent and Sussex coasts. But these tales of loss aren’t the only ones to be told, as a staycation summer gives fading seaside glories one last chance to reintroduce themselves.
Recently I had some time to kill in Bangor, Gwynedd, although that’s a story for another day. Someone kindly showed me around its botanic gardens, a hidden delight known only to local dog walkers, where luscious fresh passion fruits grow under glass. The town’s high street has arguably seen better days, but it has a lovely pier reaching out towards Anglesey, and for 50p you can spend as long as you like watching the tide come in through the gaps in the boards beneath your feet. There’s a cafe serving rhubarb crumble ice cream, but I was drawn to a line of plaques along the railing, mostly marking departed loved ones, including one for “Florence Magdalen Feasey, who swam the Menai Strait in 1929 aged 15 years.”
There is no mention of a spouse or children; either Florence never married, or rather thrillingly, that one great adventure was the way she chose to be defined. (The crossing from the Welsh mainland to Anglesey is less than a mile but notoriously dangerous, with fast running tides and swirling whirlpools.) Whoever she was, Florence must have been fearless.
And that’s what British seaside towns excel at: surprises. They’re all about the unexpected, the quirky, even the subversive; places for mooching around and stumbling across things, boasting a certain indomitable spirit born of constantly having to think of stuff to do in the rain. And that makes them natural wellsprings of creativity. (It’s probably no coincidence that the maybe-Banksys have appeared just as Great Yarmouth and Lowestoft are jointly bidding to become the 2025 UK City of Culture; art’s role in economic regeneration is not to be underestimated, given the Tracey Emin effect in Margate further down the east coast.)
British seaside towns may never realistically trump the Med as places to spend a sun-soaked fortnight. But they could make perfect short breaks for Britons in a climate-conscious era in which jetting off to Rome or Paris for the weekend feels too wanton, and their residents deserve better than a future oscillating wildly between unsustainable property booms and crumbling neglect.
Two years ago, a select committee report on regenerating seaside towns highlighted the success of Seaminster, a once-shabby resort that learned to make a virtue of its “romance and its grit”, after recognising that behind the tatty amusement arcades and stink of seaweed lay a place of “creativity, unconventionality and misrule”. A journalist who had grown up there was enlisted to promote it. A music festival, film-making co-operative, fast broadband and sustainable energy projects did their bit. Someone even built a sauna on a beach. The only snag, the committee admitted, was that Seaminster was fictional; it had completely made it up. But like the maybe-Banksys, if it was fake it was strangely convincing; a glimpse of what could happen given enough imagination. And who doesn’t long for them both to be real?
Councillors in Edinburgh have proposed measures to crack down on Airbnbs and other short-term lets in the city.
The council wants to create a “control area” where property owners must acquire planning permission to run a short-term let.
There has been a significant rise in such lets in Edinburgh – particularly on Airbnb – in the last five years.
Campaigners say this has exacerbated housing shortages and led to an increase in antisocial behaviour.
However, a body representing short-term let owners said the plans were “wholly disproportionate”.
More than a third of Scotland’s short-term let properties are believed to be in the capital, according to City of Edinburgh Council officials.
Under the proposals, council officers and councillors would determine whether a short-term let was suitable based on density, residential amenity and housing shortages in the area.
The control area would be city-wide and would not focus on the city centre and Leith where the majority of short-term lets are, because of fears this would lead to a high concentration of lets in neighbouring areas.
However, if a home has been continually used as a short-term let for more than 10 years before a control area is designated and no enforcement action has been taken during that time, planning permission would not be required.
Renting out a room in your house or letting your property whilst on holiday would also still be allowed.
Councillors voted to launch a consultation with the city’s residents at a meeting of the council’s planning committee. A final proposal will be sent to the Scottish government after the results of the consultation.
Separately, the Scottish government is currently consulting on legislation to introduce a licensing scheme for short-term let operators.
Campaign organisation PLACE, a network of Edinburgh residents fighting against short-term lets, said the lets often led to rent increases as well as disturbance from noisy parties, verbal abuse and damage to property.
“Neighbours of short-term lets are almost guaranteed to experience anti-social behaviour from customers,” a spokesperson added.
“Alcohol is a regular contributing factor which makes these situations particularly unpredictable and intimidating to deal with.”
However, the Association of Scotland’s Self-Caterers said the council had not provided evidence to back up the claim that short-term lets reduced available housing stock.
The organisation’s chief executive Fiona Campbell said: “Furthermore, their proposals appear to rely on pre-pandemic listings from one online platform only and this does not provide an accurate reflection of the situation.
“Self-catering properties have been a long-standing presence in the capital for decades, enhancing the tourist offering and boosting the local economy, and should not be used as a convenient scapegoat for policy failures elsewhere.”
Airbnb said it did not expect the proposed changes to affect the majority of its hosts.
However, Airnbnb director of public policy Patrick Robinson added: “We are concerned about the impact these measures could have on some hosts who bring great benefits to Scotland, and we look forward to engaging with Edinburgh City Council to secure the best outcomes for everyone.”
Another day, another example of priorities for Tory MPs – Owl
Shameless senior Tory Sir Geoffrey Cox trousered more than £900,000 working as a barrister while the Covid pandemic ripped through Britain – and failed to speak in Parliament once.
The former Attorney General has three second jobs as a barrister, including a lucrative role he began last September as “consultant global counsel” for Withers LLP with an annual salary of £468,000.
The MP for Torridge and West Devon last spoke in the Commons around 18 months ago – on January 16, 2020 – and stands accused of neglecting his constituents and being “missing in action” ever since.
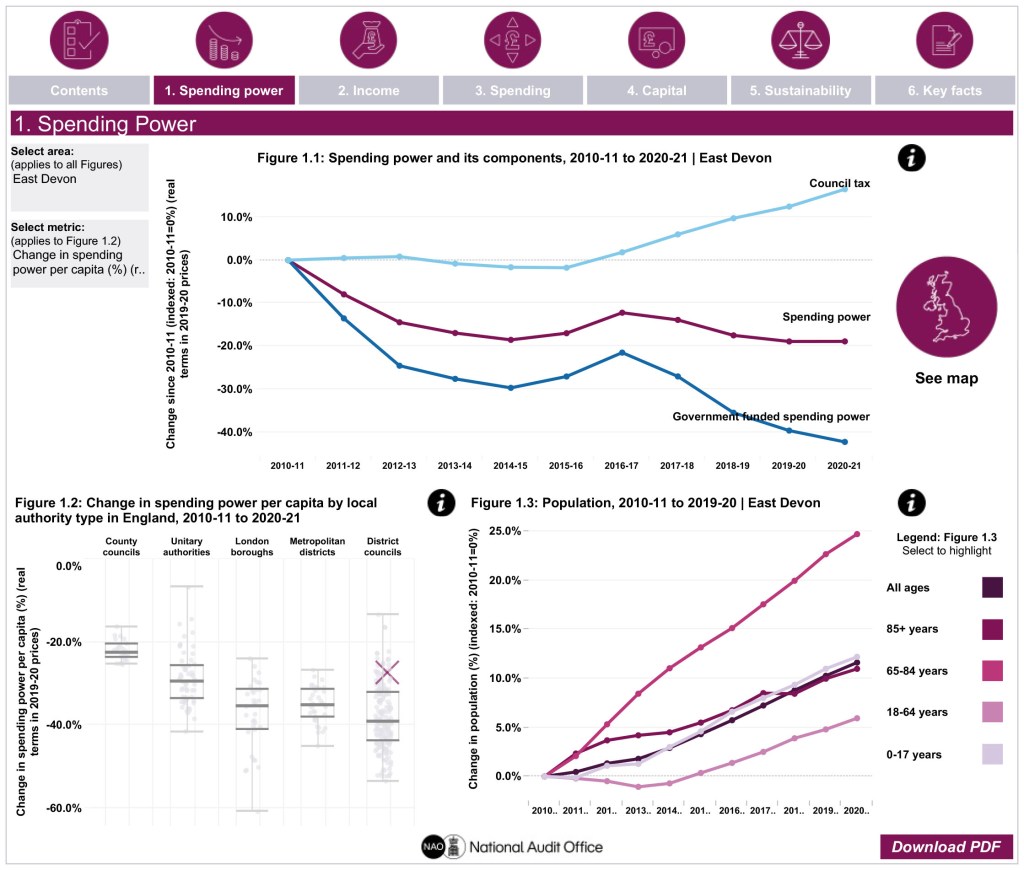
In the visualisation for a decade of data for East Devon you can clearly see the reduction of direct government funding and, despite the increase in council tax receipts, the net overall reduction in council spending power. (Fig 1.1).
You can see the switch in spending on highways, housing and the environment towards central services (Fig 3.1).
There is an interesting increase in capital expenditure charged to the revenue account in recent years (Fig 3.4).
There appears to be a curious gap in debt servicing costs around 2016 (Fig 5.3).
This is just to whet your appetite, there is a lot more to digest. – Owl
The data visualisation below describes changes in English local authorities’ financial circumstances over the last decade. [Owl has selected East Devon]
The analysis below does not cover the impact of the COVID-19 pandemic on local authorities’ finances. The national data required to undertake this analysis at the level of individual local authorities has not yet been published. However, our March 2021 report Local government finance in the pandemic sets out the pandemic’s impact at the national level.
While the pandemic has had a significant impact on authorities’ finances the fundamental patterns of financial restructuring over the last 10 years shown in this visualisation remain highly relevant. These trends shaped the financial circumstances of individual authorities and the sector as a whole entering the pandemic. They also represent the ongoing structural context that may need to be addressed in any future government reform of local government.
Key themes explored in the data visualisation include:
Reductions in revenue funding
Growth in some new and alternative income streams
Changing patterns of service spending
New capital investment strategies and associated risks
Changing patterns of financial sustainability
Purpose of the work
The objective of the visualisation is to allow you to explore the key trends identified in our recent reports in order to gain a more detailed and up-to-date understanding of the experiences of individual local authorities or groups of authorities.
The data we present show changes in income and spending alongside analysis of factors such as budget overspends and levels of reserves. These figures can change for a range of reasons such as local political priorities, changes in local demand and changes in government policy and priorities. Readers also need to bear in mind the differences in the functions and responsibilities of different types of authority. Consequently, comparisons between authorities need to be undertaken with caution. Overall, the complexity of factors underlying the data means that differences in figures presented here should not be viewed as indicative in any way of the current ‘performance’ of an authority. Any apparent differences between authorities should be seen as an opportunity to gather more information and build a richer understanding.
The data in the visualisation present a picture of the key trends affecting the sector and how individual authorities or groups of authorities compare to those trends. The analysis is not designed to identify specific authorities whose financial sustainability may be at risk. While the data in this visualisation are potentially relevant to an assessment of individual authorities’ financial sustainability they by no means represent a full assessment. Other data resources focused on financial sustainability, such as the Chartered Institute of Public Finance and Accountancy’s (CIPFA’s) Financial Resilience Index, are available.
Spending power: The Ministry of Housing, Communities & Local Government measures the impact of reducing government funding on local authority income via ‘spending power’. This indicator captures the main streams of government funding to local authorities alongside council tax.
Data in Figure 1.1:
Estimates of change in spending power: Due to regular changes to local authority duties and reporting arrangements since 2010-11 like-for-like comparisons over time are only possible if the data are adjusted to account for these changes. Each year the Department publishes an adjusted version of the year’s data that is comparable to the previous year, enabling comparison between pairs of years. We use this to create a chain-linked index for the years 2010-11 to 2019-20, in which pairs of adjusted years are linked by a weighting process. Because the data are weighted they will not match spending power and council tax data published by the Department precisely. We exclude Public Health Grant, the original Better Care Fund and other NHS health transfers from our analysis of spending power. For full details please see the standalone methodology from our 2018 report. Note that spending power does not include a measure of authorities’ above baseline retained business rates growth.
Government funded spending: Government funded spending power is defined as the grants and funding streams listed by the Department in any given year as components of spending power, with the exception of council tax, Public Health grant, and transfers from health bodies. This definition includes an assumed amount for 50% retained business rates.
Council tax: Data are taken from the spending power series published by the Department. The data are weighted through a chain-linking process and will therefore not match data published by the Department.
Demographic data in Figures 1.2 and 1.3: We use ONS local authority-based population estimates by single year of age from June 2021. We group these data into age bands in Figure 3.3. The data were sourced from NOMIS. For the per capita analysis of change in spending power in Figure 3.2 we use the total population data in Figure 3.3.
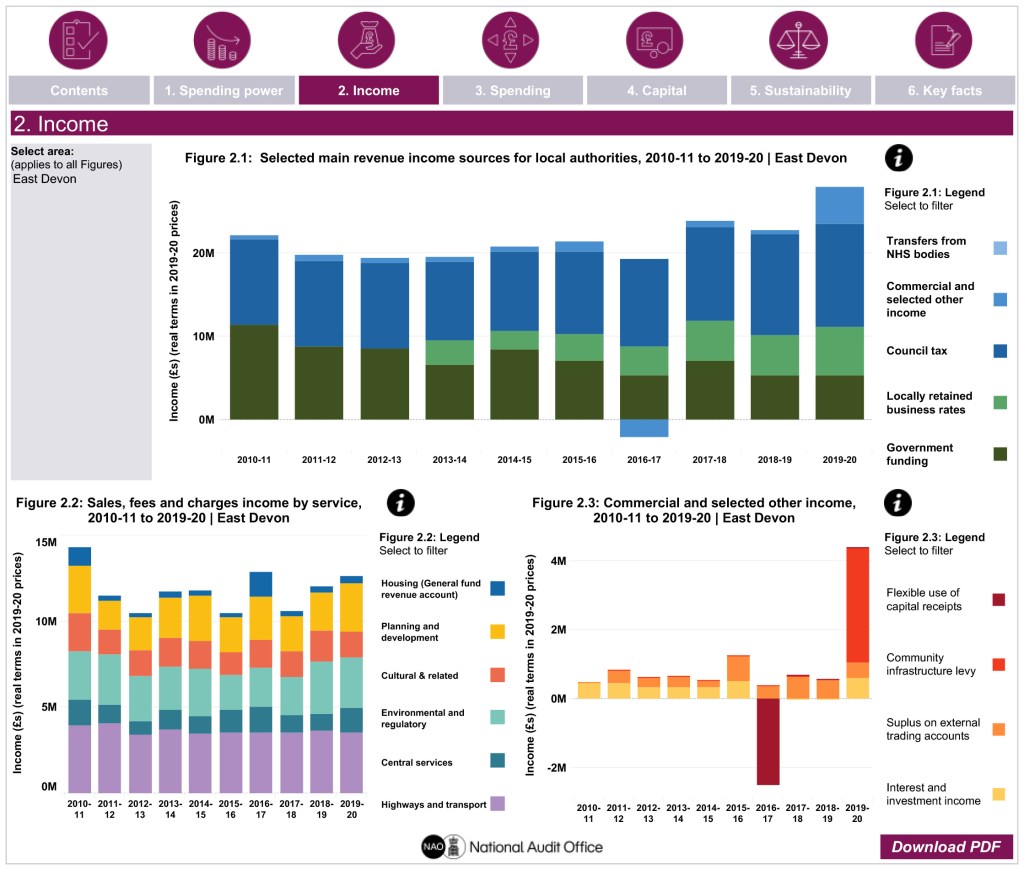
Dashboard 2 – Income
This dashboard shows a broader set of revenue income streams than those shown in the spending power data in Dashboard 2. While spending power is the Department’s preferred measure of revenue income, it is nonetheless informative to set out this wider set of income streams available to local authorities to fund service provision.
Data in Figure 2.1:
Government funding includes redistributed non-domestic rates, revenue support grant, area-based grant, local service support grant, and special and specific grants inside aggregate external finance (excluding schools grants). We exclude public health grant. We include a broader range of government grants than in spending power. We also do not weight the data to address any year-on-year discontinuities. As such the figures for government funding in this Figure are not directly comparable to those in the spending power dashboard. We do not include COVID-19 grants received by local authorities in late March 2020.
We show NHS transfers to support adult social care. These are taken from NHS Digital’s PSSEX and ASC-FR data.
We show income from locally retained business rates. In contrast to spending power data this will include retained income from above baseline business rates growth. Data are from the Department’s RS return.
Council tax figures are not comparable to those in the spending power dashboard which have been weighted to address year-on-year discontinuities. A key issue is the switch from council tax benefit to council tax support in 2013-14. Funding for council tax benefit forms part of council tax income prior to 2013-14 in Figure 2.1. Funding for council tax support from 2013-14 onwards appears in government funding.
Commercial and selected other income includes four income streams. We include surpluses/deficits on trading services accounts (gross of capital charges) and interest and investment income. We also include levels of the flexible use of capital receipts by local authorities. For a temporary period, government has allowed local authorities to use capital receipts to meet the revenue costs of transformation programmes. Under normal circumstances capital receipts are generally only available to fund capital investments. Finally, we include income received from community infrastructure levies.
Data in Figure 2.2: We show sales, fees and charges income for each named service area. Income generated through sales, fees and charges in a particular service is used to support the further provision of the service in question. Data are taken from the Department’s RSX form. We include an estimate of non-schools education sales, fees and charges income. This is based on our estimate of spend on non-schools education (see methodology section on Dashboard 3 below). We calculate our estimate of non-schools education spend as a share of total education services spend in any given year. We then apply this figure on a pro-rata basis to education services sales, fees and charges income to calculate an estimate for non-schools education sales, fees and charges. We recognise that this pro-rata approach is unlikely to reflect the actual distribution of sales, fees and charges income between non-schools and schools spending precisely, but any alternative approach is likely to be excessively complex for our purposes.
Data in Figure 2.3: We include surpluses/deficits on trading services accounts (gross of capital charges) and interest and investment income. We also include levels of the flexible use of capital receipts by local authorities. Finally, we include income received from community infrastructure levies.
Dashboard 3 – Service and non-service spending
Default data are shown for change in net spend. Net current expenditure is funded by an authority’s own resources, such as business rates, grants and council tax. This is in contrast to total spending which includes net spending but also includes spending supported by other sources of income. This includes income from sales, fees and charges or ‘other income’ such as transfers from other public bodies.
Net spend can fall due to both reductions in total spend and increases in income. Growth in income reduces the need for authorities to use their own resources (which registers as net spend) to support spending. In some instances, an authority may register negative net expenditure in a particular service area. This means that its income has outstripped its net spend in that year. Negative net expenditure is effectively net income. In our analysis of change in spend over time by service area, where an authority has experienced an increase in net income (i.e. its income outstrips total expenditure more in the second period than the first), or where it has moved from a position of positive net spend to net income, this will show as a decrease in net spending in the visualisation. Where an authority moves from net spend in 2010-11 to net income in 2019-20 this will show as a reduction of over 100% in net spending in the visualisation in Figure 3.1.
Sales, fees and charges income into Figures 3.1 to 3.3: We include the option to show the data in these charts either not or gross of sales, fees and charges income. However, we do not include service spend funded by ‘other income’. This income line includes recharges and as such creates the risk of double counting.
Highways and transport data in Figure 3.1 to 3.3: There is a discontinuity in the data for district and county councils in 2011-12 due to the transfer in concessionary fares between these two types of authorities. Responsibility, and the associated funding, for concessionary fares in two tier areas was transferred from district to county councils. This has the effect of reducing net spending for many district councils from 2011-12. As a result, from 2011-12 onwards for many district councils, sales, fees and charges income in highways and transport exceeds the level of net spend funded from their own resources. This is shown in the data visualisation as negative net spending, or net income. Where an authority moves from net spend in 2010-11 to net income in 2019-20 this will show as a reduction of over 100% in net spending in the visualisation in Figure 3.1.
Data in Figures 3.1 and 3.2:
All data are taken from the Department’s RS data return. We do not show data in Figure 3.1 for housing services and planning and development spend for county councils. These authorities do not have (significant) responsibilities in these areas and therefore only record minimal, if any, spend. Presenting this in Figure 3.1 which shows percentage change, could be potentially misleading. However, we do include this residual spend in Figures 3.2 and 3.3 (and Figures 5.2 and 5.4). Similarly, in Figure 3.1 we do not include the spend recorded by a small number of district councils on adult or children’s social care as they do not have statutory responsibilities for these services. However, in contrast to county councils, we do not include this spend in Figure 3.2, 3.3 or anywhere else in the data visualisation. The sums recorded by district councils in these areas are not material and are potentially confusing.
Adult social care spend: We adjust this data to include an estimate of funding transferred from NHS bodies to local authorities to support adult social care. This is necessary not only to capture income provided through funding lines such as the original Better Care Fund but also to capture Valuing People Now transfers in 2010-11. We use data on NHS transfers to individual local authorities contained in the PSSEX and ASC-FR data sets published by NHS Digital. These local authority level figures are slightly higher than the national totals NHS Digital publishes for the key NHS transfers relevant to our work, suggesting that the local data also contains other NHS transfers. However, the local data are broadly in line with the scale and direction of travel of the national data on key transfers. In our assessment the adjusted data provides a more accurate view of the resources used by local authorities than the unadjusted data.
Children’s social care spend data has been adjusted. In 2014-15 a number of sub-service spending lines were moved in the data returns from education services to children’s services. In order to ensure consistency over time we move these two sub-services – Sure Start and services for young people – from our children’s services figures back into education services from 2014-15 onwards. This adjustment applies wherever children’s social care spending appears in the data visualisation.
Non-schools education spending includes spend recorded under the education services line in the Department’s RO data returns. However, we have stripped out spending by schools and spending passed through local authorities to support adult education. We add spending on Sure Start and services for young people into this line from 2014-15 onwards to enable a like for like comparison over time. For full details and caveats please see the standalone methodology that accompanied our 2018 report. In a small number of cases our adjustments create anomalies in individual years for individual authorities. We address these by replacing the adjusted data for the years in question with interpolated data based on the preceding and subsequent years. This metric is an estimate and needs to be used with caution. However, we feel there is value in including it in our analysis as there is a clear imbalance between change in income and change in spending as reported in the RS if it is excluded.
Highways and transport and environmental and regulatory services: We include levies paid by authorities to passenger transport authorities and combined authorities, and waste disposal authorities in the relevant service lines.
Housing services: In line with the RS form, we only show revenue spend from the general fund revenue account (GFRA). We do not include revenue spend from the housing revenue account (HRA).
Spending on public health is excluded: Local authorities were given public health responsibilities in 2013-14. Given the complexities of including this activity for only an element of the data visualisation’s time period we exclude this spending from this dashboard and across the data visualisation as a whole.
Data in Figure 3.3: ‘All services’ includes all the services listed in Figure 3.2 for each authority. For single tier and county councils, social care spend includes adult and children’s social care. Non-social care includes all the remaining service areas listed in Figure 3.2 for each authority. Figure 3.3 includes an option to view the data for ‘all services’ on a per capita basis. We use the total population data presented in Figure 1.3.
Data in Figure 3.4: We include capital expenditure funded from the revenue account (CERA) (excluding public health CERA), minimum revenue provisions and interest payments (adjusted for HRA item 8).
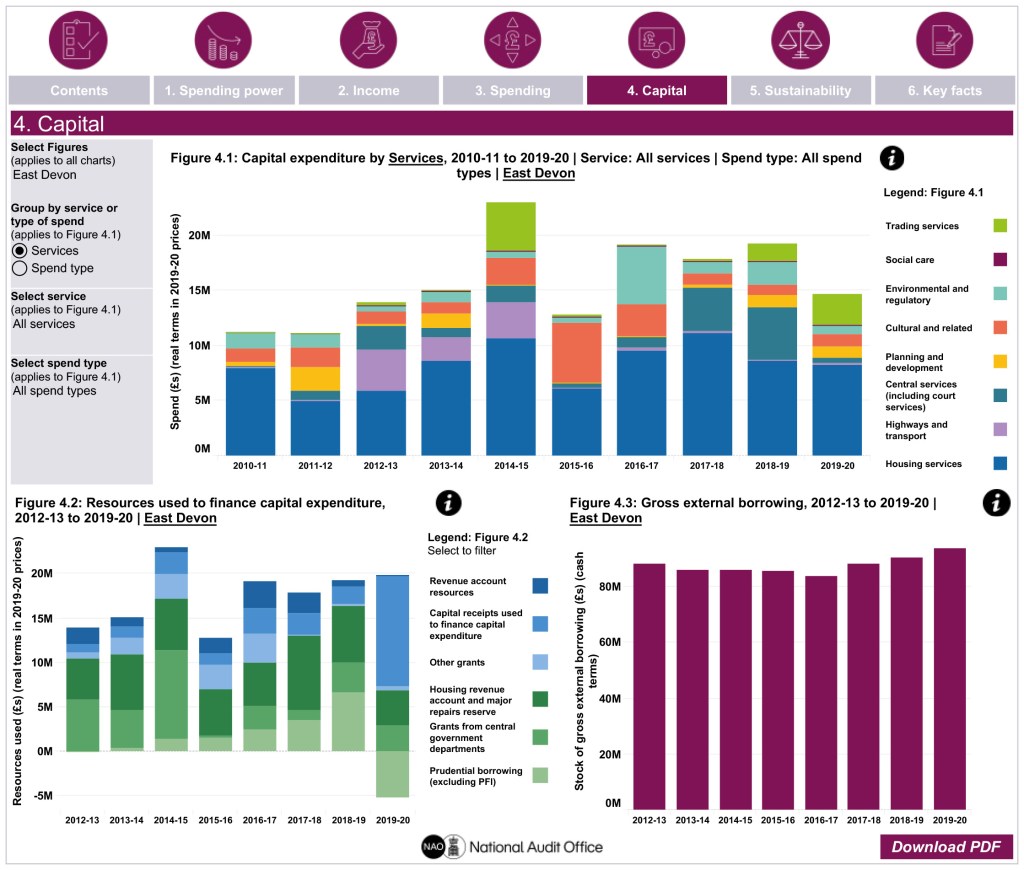
Dashboard 4 – Capital
All data are taken from the Department’s annual capital outturn return (COR) data set.
Data in Figure 4.1: We show total capital expenditure by service area and type. This includes total expenditure on fixed assets and total financial expenditure. We exclude ‘other transactions’. We do not include capital expenditure on education services and some other service areas. Housing spend is funded from the general fund revenue account (GFRA), the housing revenue account (HRA) and the major repairs reserve.
Data in Figure 4.2: These data include capital spend on all service areas as it is not possible to identify individual service areas within this data. As such, these data are not directly comparable with Figure 4.1 which excludes education and some other service areas. Data on prudential borrowing refers both to spend supported by external borrowing, and also to spend funded by internal borrowing. This is a treasury management practice whereby an authority delays the need to borrow externally by temporarily using cash it holds for other purposes, such as insurance funds held in earmarked reserves. The chart starts in 2012-13 rather than 2010-11 in order to avoid the discontinuity created by the localisation of authorities’ housing revenue accounts in 2011-12.
Data in Figure 4.3: We show the stock of gross external borrowing as of 31 March in each year. Data are from the COR in cash terms. The chart starts in 2012-13 rather than 2010-11 in order to avoid the discontinuity created by the localisation of authorities’ housing revenue accounts in 2011-12.
Dashboard 5 – Financial Sustainability
We show a selection of measures of financial sustainability drawn from across our recent studies. While these provide some insight into the financial sustainability of authorities, they do not represent a full analysis.
Data in Figure 5.1: We show data for unallocated and earmarked reserves. We exclude public health, schools, and dedicated schools grant (DSG) reserves. We show data as a share of our chain-linked measure of spending power. Net revenue expenditure is our preferred denominator, but inconsistencies in the way that some authorities have recorded data in the RO over this period mean that this metric is not sufficiently stable. Our weighted spending power timeseries provides a similar, but more stable measure. The main data we show for reserves are as reported by local authorities and published in the RO.
We also include an option to view an adjusted measure of authorities’ reserves. In late March 2020, local authorities received additional funding to support their COVID-19 response. Given this proximity to the end of the financial year, this funding was not necessarily spent in 2019-20 and some authorities included it within their 2019-20 end of year reserves. This has the effect of seemingly inflating some authorities’ reserve levels in that year. We therefore provide an adjusted measure of reserves that seeks to strip out this additional funding from authorities’ reserves. We do this by subtracting the value of the COVID-19 grants from authorities’ earmarked reserves as of 31 March. In recognition of the fact that not all authorities recorded this grant funding in their reserves however, we use the authorities’ estimates of their reserves as of 1 April 2020, as reported in their RA budget returns, as a benchmark. The RA returns were submitted before the 2019-20 RO return, and unless specified in the return, reflect authorities’ budget planning before COVID-19 and the associated grant funding were a significant feature. If our adjusted earmarked reserves figure from the 2019-20 RO is below an authority’s estimated earmarked reserves for 1 April in its 2020-21 RA return we assume that the authority did not record their COVID-19 grants in their reserves, and we therefore do not adjust their RO figures. There are a small number of authorities that state in their 2020-21 RA that they have adjusted their reserves to reflect COVID-19 grants. For these authorities we assume that these grants were also in their reserves in their 2019-20 RO return, and therefore we have adjusted their 2019-20 earmarked reserves. Clearly our figures are estimates and need to be treated with caution, and we would recommend that readers engage with local information sources such as authorities’ annual accounts. Nonetheless we think they are worthy of inclusion as there is a risk that the sector’s reserves are over-stated otherwise.
There is a further discontinuity in the reserves data timeseries in this data visualisation. In 2018-19 the Department asked single tier and county councils to identify dedicated schools grant (DSG) reserves separately in their reserves data. Some authorities had previously recorded this data in their schools reserves. However, we estimate that around a third of authorities had previously recorded their DSG reserves in their earmarked reserves and a further small number in their unallocated reserves. The fact that these authorities have now started recording their DSG reserves separately creates a potential discontinuity in our data series for earmarked and unallocated reserves. It would be possible to adjust for this by adding DSG reserves back into these authorities’ reserves from 2018-19 onwards. However, this would create two separate and non-comparable groups of authorities in this period, one with DSG reserves in their earmarked and/or unallocated reserves and one without. Given this, as well as existing complexities around the COVID-19 grants’ impact on reserves and the fact that in most cases the DSG discontinuity is not material for individual authorities, we have not included this adjustment in the data visualisation. However, readers should bear this potential discontinuity in mind when considering the reserves timeseries for single tier and county councils.
Data in Figure 5.2: We show outturn against budget data for all the services shown in Figure 3.2 for each authority. However, we exclude non-schools education and we do not include NHS transfers in our measure of adult social care spend. Budget data for these two figures is not available. We start the time series in 2011-12 as budget (RA) data are not comparable with outturn (RO) data at the service level in 2010-11. The metric shown is the difference between outturn and budget spend calculated as a percentage of an authority’s overall service budget. A positive figure indicates that the level of outturn spend exceeds the planned budget spend – an overspend. For single tier and county councils we include the option to focus separately on adult social care, children’s social care and spending on all other service areas (as defined in Figure 3.3). For each of these three service areas we show the variation between outturn and budget as a share of that specific service area’s budget.
Data in Figure 5.3: We include interest payments (adjusted for HRA item 8) minimum revenue provision and leasing payments in our measure of debt service costs. We use our chain-linked measure of spending power to standardise the data (see notes on Figure 5.1).
Data in Figure 5.4: We show spend on adult and children’s social care. We adjust adult social care to include estimated transfers from NHS bodies. The all services denominator includes all the service areas shown in Figure 3.2.
Dashboard 6 –Key Facts
All data shown in this dashboard are taken from Dashboards 1 to 5.