UK perceived as more corrupt, falling to its lowest score on global index

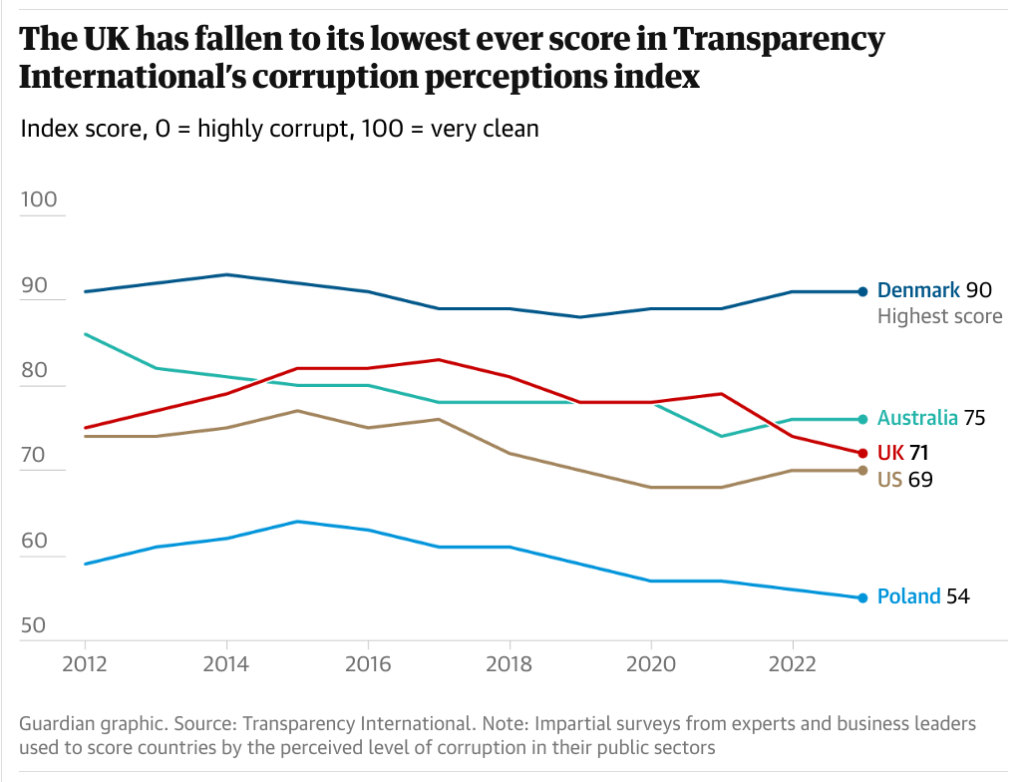
The UK has fallen to its lowest-ever position in Transparency International’s corruption perceptions index, which ranks countries by experts’ views of possible corruption in public services.

Rupert Neate www.theguardian.com 

The UK fell from 18th (out of 181 countries) in 2022 to 20th in 2023, its lowest position since the research was revamped in 2012. It means that, according to the research, Britain is seen as more corrupt than Uruguay and Hong Kong.

The lower ranking coincides with concerns about possible corruption in the awarding of PPE contracts during the pandemic, according to the research published on Tuesday and based on “impartial surveys from experts and business leaders”. The UK was ranked at between the eighth and 11th most transparent country in the world between 2012 and 2021. However, it fell to 18th in 2022, and then joint-20th in 2023.

Daniel Bruce, the chief executive of Transparency International UK, said the findings should act as “a wake-up call for government”.

“The continued fall in the UK’s score shows a country heading in the wrong direction. It’s clear that business leaders and other experts are more concerned than ever about political corruption and the abuse of public office in the UK,” Bruce said.

“We need urgent action from ministers – not just words – to restore much-needed confidence in the integrity of political and public life.”

The total corruption perceptions index score awarded to the UK was 71 out of 100 (where zero means a country is perceived as highly corrupt and to 100 means it is perceived as very clean). It is the lowest the UK has ever scored on the index, and a drop of two points on 2022 and nine on 2018. The UK has experienced the biggest five-year decline of any western European country, according to the research.

The score is based on data from eight independent sources, including the Economist Intelligence Unit and the World Economic Forum. “All surveyed experts and business executives for their views on abuses of public office for private gain and bribery in the UK,” Transparency International said.

The anti-corruption charity said the scandal around the awarding of PPE contracts during the pandemic and concern that “both the UK government’s anti-corruption champion and independent advisor on ministerial interests [had] resigned”.

It added: “The data shows that while perceptions of bribery generally are improving, there are growing concerns over cronyism and patronage in politics, and its effect on the management of public funds.”

Denmark is ranked as the least corrupt, followed by Finland and New Zealand. South Sudan, Syria, Venezuela and Somalia are at the bottom of the rankings, meaning they are seen as the most corrupt. The US is 24th.

2011 ‘Graph of Doom’ now looks prophetic

In 2011, two senior council managers in north London put together a PowerPoint graph that they felt might help kick off a useful discussion with colleagues about the future of local government. What would happen, they asked, if town hall funding flatlined, while demographic pressures continued to rise steadily?

Patrick Butler www.theguardian.com

The answer, they suggested, lay in what became known as the Barnet Graph of Doom. It indicated that the council would, within 20 years, expend all its available resources on meeting the needs for adult social care and children’s services. There would be simply be no cash left for libraries, parks, leisure centres or even bins.

The Graph of Doom became a kind of meme in policy circles, a bleak joke, reality check and austerity warning. The late former head of the civil service Bob Kerslake was known to feature it in presentations. Birmingham city council produced its own version in 2012, labelled the “Jaws of Doom”, which its former leader Sir Albert Bore suggested depicted the “end of local government as we know it”.

“We were trying to explain to colleagues that just as the party was over for bankers [post-crash], so the era of growth would be over for the public sector and there would be less money around,” recalls Nick Walkley, Barnet’s chief executive at the time. “It was not meant as a predictive model. We wanted people to start thinking through strategic priorities.”

Back then, though, austerity was in its infancy, and local government was still relatively brimming with confidence and resources. There was widespread disbelief that such a scenario could come to pass, and the graph would often be seen as a provocation, says Walkley: “Even at that time it seemed quite shocking that an authority would have to choose between libraries and adult social care.”

Thirteen years later, the graph of doom has not come to pass, at least not yet. But it has proved far more prescient an indicator of travel than its authors envisaged. Council funding has shrunk by roughly 40% over the period, demand for social care has continued to rise, and councils have made room for these growing costs by shutting down other services.

Top-tier local authorities’ remaining spending power is increasingly dominated by adults and child social care, for which they have defined legal and regulatory duties. The two services can take up as much as 70% of council budgets, at the expense of what have come to be known as “discretionary” services such as parks, leisure centres, arts, youth clubs, children’s centres, community buses, recycling and climate change.

But has even this endless squeezing reached its limit? Conservative-run Hampshire county council warned in October that it would face financial “meltdown” within the next 18 months without some kind of government intervention. It was no longer possible, it said, to meet the boundlessly growing cost of social care simply by continuing to reduce or close non-core services.

Some councils are starting to discuss a graph of doom-ish scenario, where the price of keeping statutory social care services in place is the abandonment of the rest of the council’s functions. Next year, Hampshire argues, either the government bails out councils, or it reduces their statutory burden to allow them to do less. “These are not problems we can fix on our own,” it says.

Looking back, Walkley says it was assumed the graph would never come to pass because the government would step in to solve the crisis in adult social care. It was an age of optimism for councils, and doing nothing did not seem to be an option. But ministers ducked the social care funding question, and the need for children’s services has exploded unchecked. “We never envisaged an un-solution,” says Walkley.

Devon homebuilders ‘must meet’ affordable housing levels

Another South Devon council has taken aim at developers who don’t meet their obligations to provide affordable housing for local families.

Guy Henderson – Local Democracy Reporter www.radioexe.co.uk 

Teignbridge councillors will soon vote on a motion which accuses developers of ‘deception’ around their commitments to build affordable homes and play areas.

Now their counterparts in the South Hams have fired their own salvo in the battle to make sure housing developments include enough sufficient affordable properties. 

Discussing their action plan for housing and homelessness, councillors underlined their existing policy for a minimum of 30 per cent of new South Hams’ homes to be affordable.

But developers often cite figures which show that it would be unviable for them to meet the 30 per cent threshold.

Cllr John Birch (Lib Dem, Totnes) said on one major local development for almost 200 homes, no affordable housing at all were constructed.

He said: “Because the financial viability study says they are only making £30million, they can’t afford to do it. This is totally unacceptable and we as a council need to resist this approach.

“There is evidence of us being too soft as a council when applying this policy.”

And Cllr Nicky Hopwood (Con, Woolwell) added: “I don’t give a damn if a developer can afford it or not. If they can’t afford it, don’t build the houses there.

“If we are ever going to solve the housing crisis in the South Hams we need to get the 30 per cent. We have a serious shortage.

“We need to say that we as a council will not accept developers saying they can’t afford anything.”

However, council leader Julian Brazil (Lib Dem, Stokenham) pointed out that when the council had turned down developments that failed to meet the threshold, government inspectors had overturned the decisions.

“Sometimes it is out of our hands,” he said. “But the mood of this council is absolutely right.

“We said 30 [per cent]. We mean 30. If you go outside of that you’ve got to have some damn good reasons.”