Following an earlier post, Owl has been asked to show the “popup” details of the plans, baseline and recent performance data for each storm overflow in Exmouth for comparison.
These “popups” are a bit elusive and disappear with only a slight move of the cursor.
The combined sewer outfalls associated with treatment works are also elusive, disappearing, for example, when “East Devon” is selected as the area of interest within the South West Water catchment.
The title of the interactive map is the National Storm Overflow Plan and seems to exclude all emergency overflows associated with sewage pumping stations such as at Phear Park.
Exmouth sewage treatment works CSO – all targets by 2027
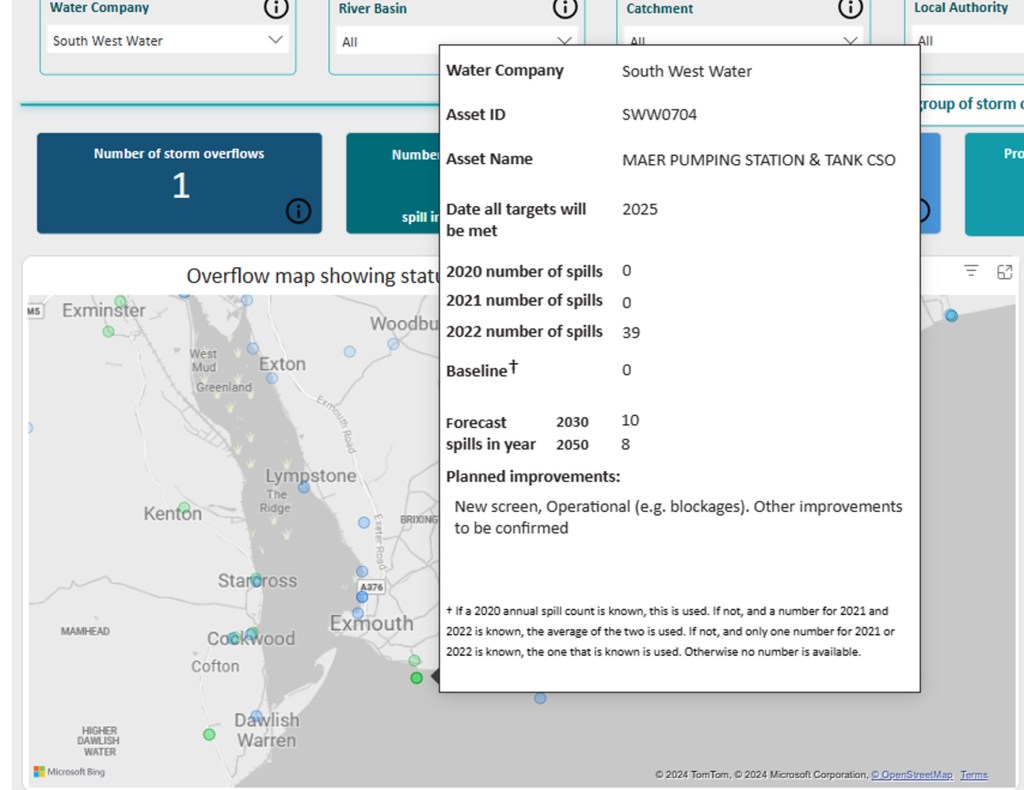
Maer pumping station and tank CSO – all targets by 2025
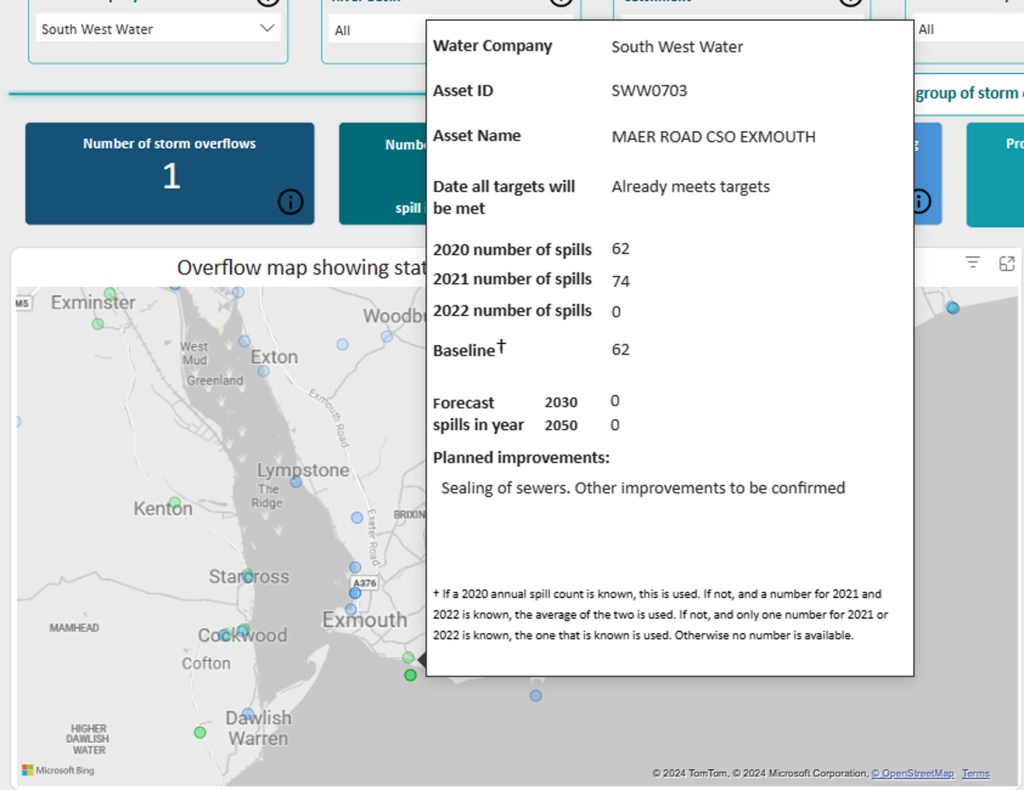
Maer Road CSO, all targets already met
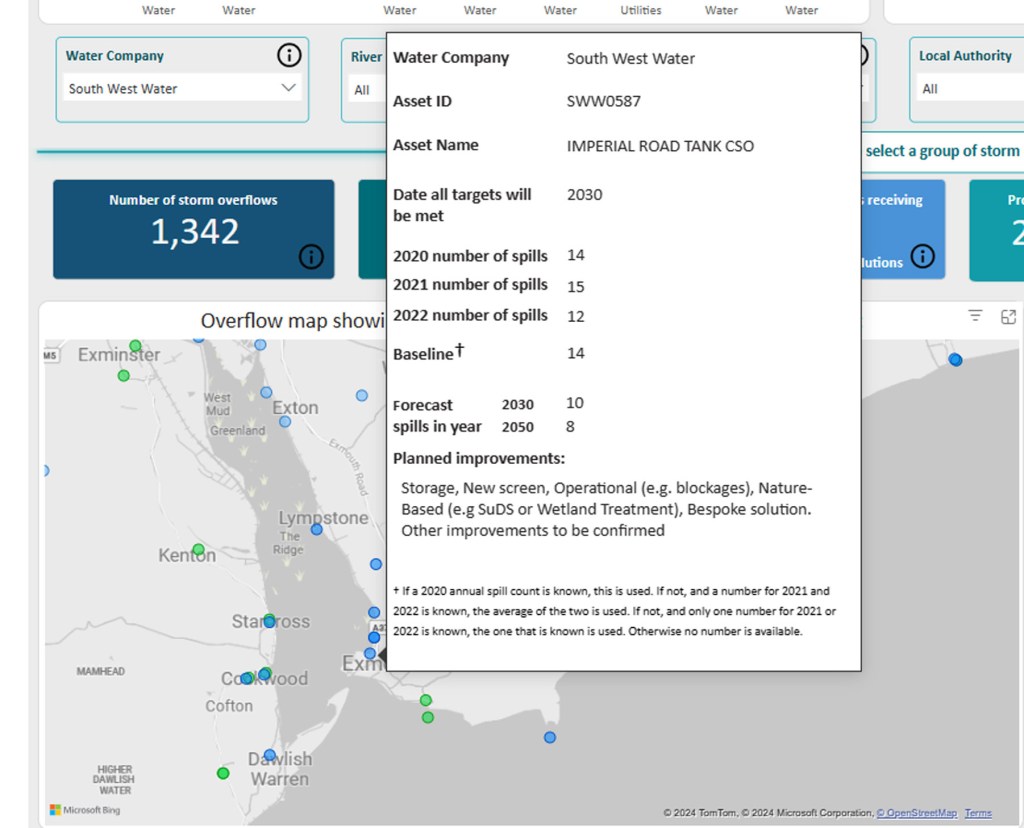
Imperial Road tank CSO – all targets by 2030
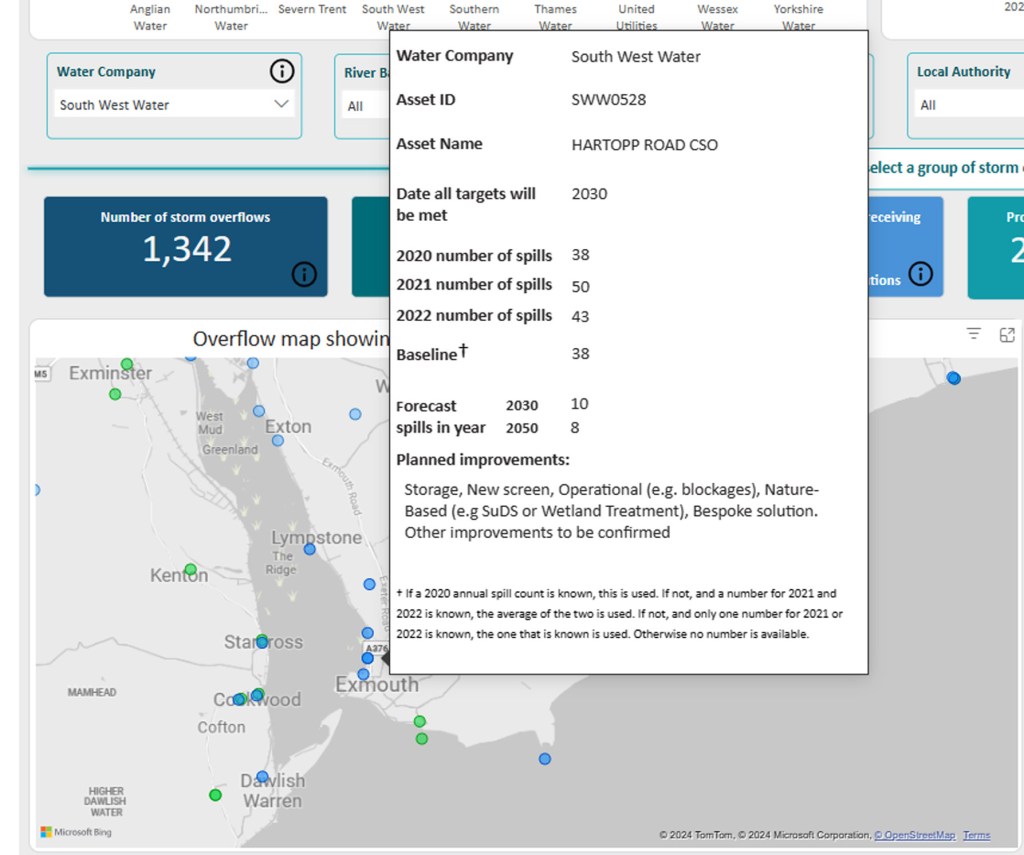
Hartopp Road CSO – all targets by 2030
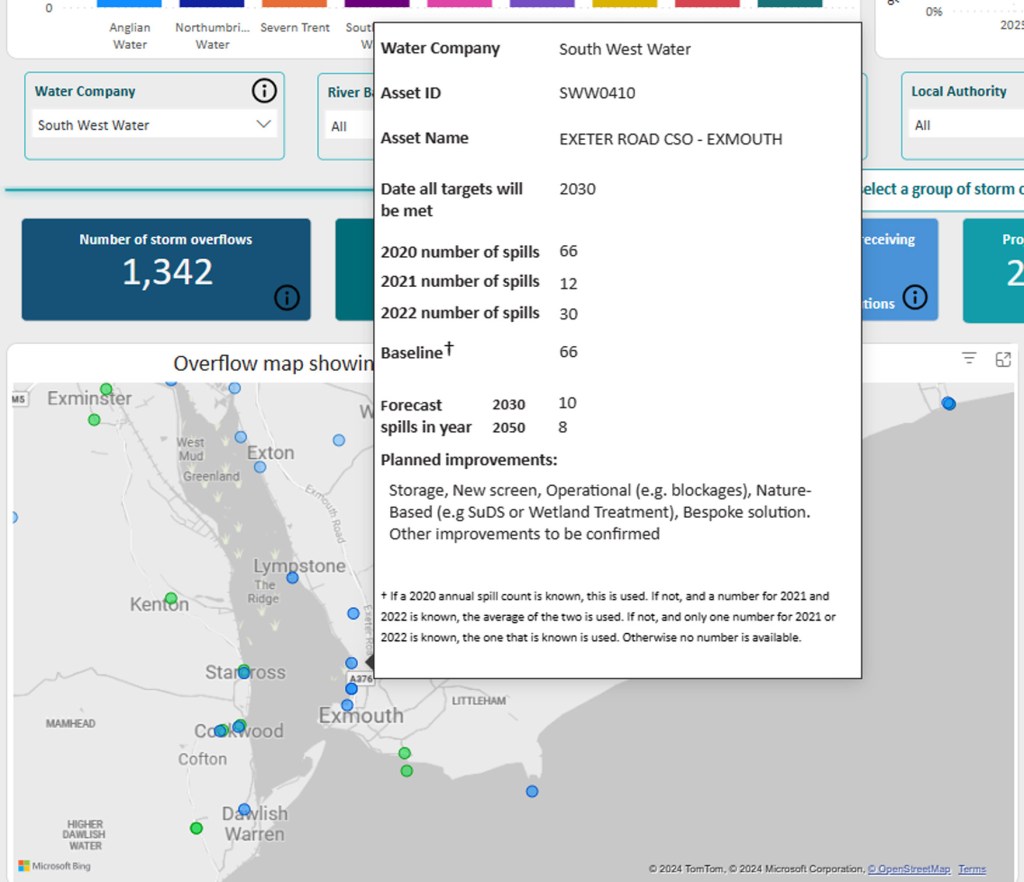
Exeter Road CSO – all targets by 2030
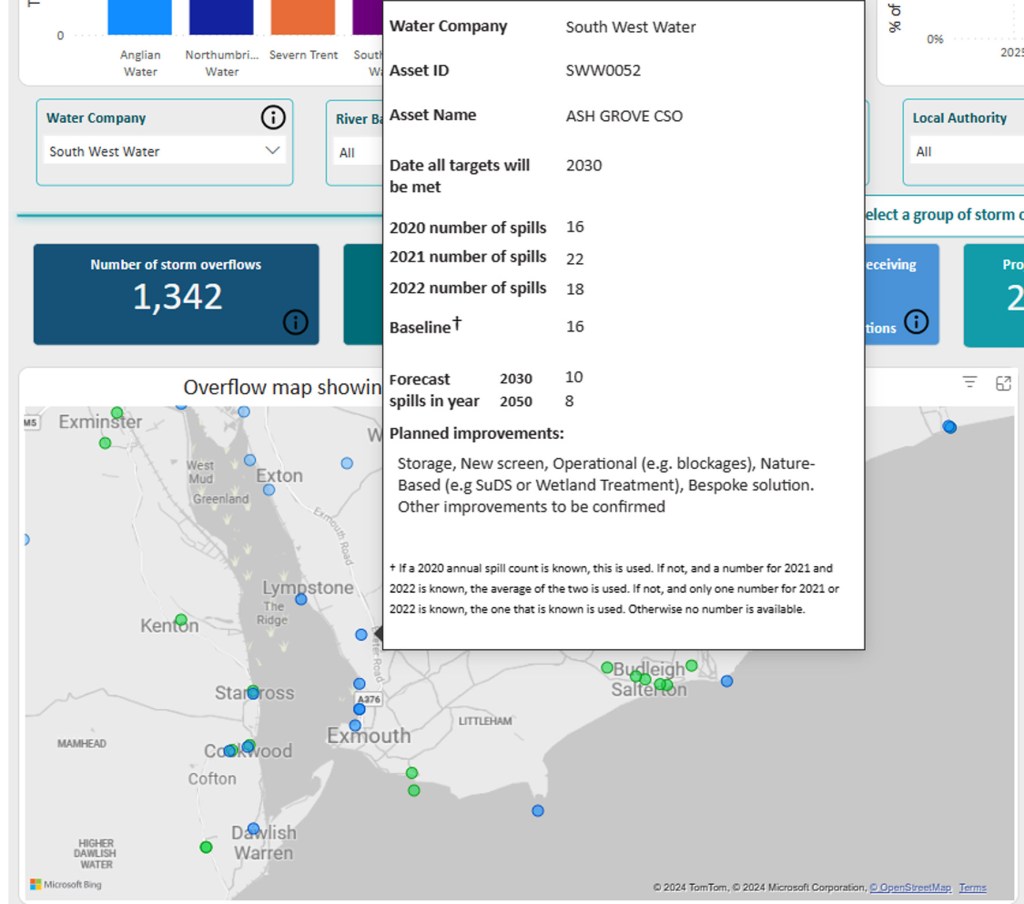
Ash Grove CSO – all targets by 2030
In many cases the estimated number of spills remaining after 2050 is a consistent “8”. How big an improvement this represents in these cases depends on the “calculation” of the baseline figure. In some cases it represents only a 50% reduction.
Base Map for the Exe and local bathing beaches

Exmouth sewage treatment works CSO

Maer pumping station and tank CSO
Maer Road CSO
Imperial Road tank CSO
Hartopp Road CSO
Exeter Road CSO
Ash Grove CSO