Owl’s selection of interesting insights. Especially the finding that Infections are higher than in the corresponding week of the second wave, but, mercifully, hospital admissions and deaths remain lower. Registered deaths in the South West are comparatively low but are increasing.
Coronavirus (COVID-19) cases continued to be high in England and Northern Ireland in the latest week, while the trend is uncertain in Wales. Infections have decreased in Scotland.
The estimated percentage of the community population (those not in hospitals, care homes or other institutional settings) that had COVID-19 in the latest week was:
1.33% (1 in 75 people) in England in the week ending 6 August 2021
0.46% (1 in 220 people) in Wales in the week ending 7 August 2021
1.88% (1 in 55 people) in Northern Ireland in the week ending 7 August 2021
0.53% (1 in 190 people) in Scotland in the week ending 7 August 2021
Across England, infections increased for those between school Year 12 and those aged 24 years, while the trend is uncertain for all other age groups.
Infections have also decreased in the North East, North West, West Midlands and London. In other regions, the trend is uncertain in the latest week.
Although the percentage of people in England testing positive for coronavirus continued to be high in the latest week, our modelled estimates suggest an overall decrease in people testing positive over the past two weeks.
Hospitalisations and deaths are below second wave levels
Infections are higher than in the corresponding week of the second wave, but hospital admissions and deaths remain lower
Estimated percentage of the population testing positive for COVID-19, number of hospital admissions per 100,000 people, and number of deaths involving COVID-19, England
Infection levels in the week ending 6 August 2021 were higher than in the corresponding week of the second wave (week ending 21 November 2020). Despite higher infection levels, hospital admission rates and number of deaths involving COVID-19 are lower in the third wave. There were 6.63 hospital admissions of COVID-19 confirmed patients per 100,000 people in the week ending 8 August 2021, compared with 15.60 in the corresponding week of the second wave (week ending 22 November 2020). There were 389 deaths involving COVID-19 registered in England in the week ending 30 July, compared with 2,274 in the corresponding week of the second wave (week ending 13 November 2020).
The rise of COVID-19 infections was slower in the first few weeks of the third wave in comparison with the second wave. There is a period of time (lag) between a person becoming infected with COVID-19 and being admitted to hospital or dying because of it. Therefore, we might still see a change in hospital admissions and deaths corresponding to the recent changes in the infection levels.
The second wave of COVID-19 infections is estimated to have started in the week beginning 4 September 2020, and the third in the week beginning 23 May 2021. However, these are not exact dates and should be treated with caution.
You can read more about our definitions of waves and lags of COVID-19 in England in our technical article.
Last updated: 13/08/2021
Hospitalisations and deaths were highest in oldest age groups
In older age groups, recent COVID-19 positivity rates were lowest, but hospital admission rates and deaths were highest
Estimated percentage of the population testing positive for COVID-19 in the week ending 6 August 2021, hospital admission rates in the week ending 8 August, and deaths registered in the week ending 30 July, by age, England
Positivity rates were highest among secondary school age children (school Years 7 to 11) and young adults (school Year 12 to age 24 years) and lowest in adults aged 70 years and over in the latest week (week ending 6 August 2021). Hospital admission rates remained highest in those aged 75 years and over (week ending 8 August). The number of deaths involving COVID-19 increased in all age groups aged 45 years and over (week ending 30 July, England). The number of deaths involving COVID-19 was highest in those aged 85 years and over and lowest in children aged 14 years and under.
Last updated: 13/08/2021
Hospitalisations decreased in most English regions while deaths increased
In most English regions, hospital admissions decreased but deaths increased
Change in hospital admission rates and numbers of deaths involving COVID-19 from previous week, England, weeks ending 8 August and 30 July 2021
Hospital admission rates of COVID-19 confirmed patients decreased or remained similar in all English regions except East Midlands in the week ending 8 August 2021. The largest decrease was seen in the North East.
The number of registered deaths involving COVID-19 increased in seven of the nine English regions in the week ending 30 July. The largest increase was recorded in Yorkshire and The Humber (30 more deaths).
What’s the biggest threat to Boris Johnson this autumn? Another wave of coronavirus and another lockdown? Failure at the Cop26 climate summit? A row with Rishi Sunak over the level of public spending (or perhaps about which of their pets is Downing Street’s top dog)?
No. The issue that spooks many ministers is NHS waiting lists. The number of people waiting for treatment has risen to 5.45 million in England, the highest since records began in 2007. The record will continue to be broken every month. Officials believe about 7 million more people did not come forward for treatment during the pandemic even though they might have needed it.
When Sajid Javid, the health secretary, warned that the lists could increase to 13 million, he wasn’t painting it black to strengthen his hand in budget negotiations with the Treasury. The Institute for Fiscal Studies predicts the number could be 14 million by the end of next year. The backlog could take three years to clear; ministers worry that it won’t happen by the next general election, due in 2024 but likely in 2023.
The NHS is accustomed to winter crises but this year has a summer one, as my colleague Shaun Lintern has chronicled. Even though admissions in the current Covid wave are lower than expected, NHS bosses report that hospitals are busier than they have ever been, saying that exhausted staff cannot keep working at their current pace forever.
Chris Hopson, chief executive of NHS Providers, says every part of the service is under pressure. He lists six reasons: tackling care backlogs; the loss of up to 10,000 hospital beds due to infection control measures; the number of NHS staff self-isolating; the peak annual leave season; urgent and emergency care exceeding pre-pandemic levels and 5,000 beds still being occupied by Covid patients.
Ministers, who frequently grumble that NHS chiefs cry wolf, know they are not exaggerating this time. But the government is adding to their burdens. Although the NHS is already working out how to switch to a more preventative system next April to reduce hospital admissions, Johnson overruled Javid to press ahead with yet another shake-up.
The Health and Care Bill going through parliament will hand ministers more power to direct NHS England, diverting the service’s attention from the main public and political priority of the backlog. NHS managers fear ministers will use their new powers to block proposed closures in alliance with local Tories, disrupting sensible rationalisation plans.
Labour, which cut waiting times between 2004-10 through an 18-week target from GP referral to hospital operation, notes the irony of a Tory administration taking more nationalising, micro-managing measures when devolving power would give frontline staff more flexibility to tackle the backlog.
Although spare capacity in the private sector is rightly being used to reduce waiting lists, Labour is gearing up to accuse the Tories of ushering in a two-tier health service as more people without private health insurance opt for “pay as you go” private treatment. Not a good look to the Tories’ new working-class voters who can’t afford that luxury.
Voters instinctively trust Labour on the NHS, a recognition the party was its midwife in 1948. In recent years, the Tories have had some success in neutralising the issue. After David Cameron slept on hospital floors while NHS staff cared for his late son Ivan, the public trusted him when he promised: “I’ll cut the deficit, not the NHS.”
At the start of the pandemic, the Tories benefited from a “rally round the flag” effect and moved ahead of Labour when people were asked which was the best party at handling the NHS. Despite the successful vaccine rollout, the Tories now trail by 11 points.
The sheer number of people on waiting lists will make it very hard to turn that round. If we don’t already, we’ll soon all know someone on the list. “You can’t trust the Tories with the NHS” is a dangerous Labour attack line when the NHS is in trouble. At the next election, Labour will pledge to clear the remaining backlog. So the Tories have every incentive to do it by then.
However, that would require a massive investment – a top-up in the second half of this financial year to extend a successful scheme helping hospital patients to be discharged more quickly, and a big boost in three-year spending review this autumn. Initial revenue from a proposed one percentage point rise in national insurance will help to clear the backlog, but the money can’t be spent twice and will be needed to make long overdue social care reforms work.
With Sunak facing so many rival spending demands – such as other Covid catch-up priorities, notably schools; the cost of net zero and levelling up – the fear inside the NHS is that it will not get enough. That would be a real threat to the Tories’ electoral prospects.
Gaby Hinsliff argues that British seaside towns excel at: surprises. They’re all about the unexpected, the quirky, even the subversive; places for mooching around and stumbling across things, boasting a certain indomitable spirit born of constantly having to think of stuff to do in the rain. And that makes them natural wellsprings of creativity.
A couple dance on top of a bus shelter to the music of a nearby accordion player. Children play in a boat, on a wall in a Lowestoft park. And by the beach huts in Cromer, a hermit crab with a placard reading, “Luxury rentals only” guards a pile of empty whelk shells from a huddle of homeless crabs.
A string of artworks that may or may not be by the pseudonymous graffiti artist Banksy have been discovered scattered along the East Anglian coast, raising the tantalising prospect that like everyone else who couldn’t get abroad this summer, he just went to Norfolk and hung around in bus shelters instead. “Is Banksy in Great Yarmouth?” ran the dream August headline, after a miniature cottage with his name sprayed on one side and “Go big or go home” on another was mysteriously added overnight to the resort’s Merrivale model village. Maybe it’s real, and maybe it isn’t, but it’s absolutely the sort of thing the British seaside is for.
Coastal towns get a miserable rap. Regardless of all that bracing sea air, they’re notorious hotbeds of poor health and low life expectancy (England’s chief medical officer, Prof Chris Whitty, is making tackling health inequalities in impoverished seaside towns a priority, post-Covid) and lagging educational performance. I last went to Yarmouth on the eve of lockdown, to see a school serving a deeply deprived neighbourhood that had been transformed from chaotic to thriving; but the kids still needed more decent local jobs to move into. And while some coastal towns are struggling with the loss of both a once booming industry – fishing in Lowestoft or Grimsby, bucket-and-spade tourism in Skegness or Scarborough – for others, it’s prosperity itself that is the problem.
“Don’t feed the locals; they bite,” read the handwritten sign by a pretty Cornish cove this summer, where holidaymakers were spreading towels around fishing boats drawn up on the shingle. A joke, though only just; second homers and wealthy retirees have long monopolised the prettier bits of Devon and Cornwall, and this year’s holiday feeding frenzy saw reports of landlords evicting long-term local tenants in order to cash in on renting to tourists via Airbnb. A post-Covid exodus of Londoners realising that remote working allows them to earn a city wage from the seaside, meanwhile, risks breeding resentment among priced-out locals along the Kent and Sussex coasts. But these tales of loss aren’t the only ones to be told, as a staycation summer gives fading seaside glories one last chance to reintroduce themselves.
Recently I had some time to kill in Bangor, Gwynedd, although that’s a story for another day. Someone kindly showed me around its botanic gardens, a hidden delight known only to local dog walkers, where luscious fresh passion fruits grow under glass. The town’s high street has arguably seen better days, but it has a lovely pier reaching out towards Anglesey, and for 50p you can spend as long as you like watching the tide come in through the gaps in the boards beneath your feet. There’s a cafe serving rhubarb crumble ice cream, but I was drawn to a line of plaques along the railing, mostly marking departed loved ones, including one for “Florence Magdalen Feasey, who swam the Menai Strait in 1929 aged 15 years.”
There is no mention of a spouse or children; either Florence never married, or rather thrillingly, that one great adventure was the way she chose to be defined. (The crossing from the Welsh mainland to Anglesey is less than a mile but notoriously dangerous, with fast running tides and swirling whirlpools.) Whoever she was, Florence must have been fearless.
And that’s what British seaside towns excel at: surprises. They’re all about the unexpected, the quirky, even the subversive; places for mooching around and stumbling across things, boasting a certain indomitable spirit born of constantly having to think of stuff to do in the rain. And that makes them natural wellsprings of creativity. (It’s probably no coincidence that the maybe-Banksys have appeared just as Great Yarmouth and Lowestoft are jointly bidding to become the 2025 UK City of Culture; art’s role in economic regeneration is not to be underestimated, given the Tracey Emin effect in Margate further down the east coast.)
British seaside towns may never realistically trump the Med as places to spend a sun-soaked fortnight. But they could make perfect short breaks for Britons in a climate-conscious era in which jetting off to Rome or Paris for the weekend feels too wanton, and their residents deserve better than a future oscillating wildly between unsustainable property booms and crumbling neglect.
Two years ago, a select committee report on regenerating seaside towns highlighted the success of Seaminster, a once-shabby resort that learned to make a virtue of its “romance and its grit”, after recognising that behind the tatty amusement arcades and stink of seaweed lay a place of “creativity, unconventionality and misrule”. A journalist who had grown up there was enlisted to promote it. A music festival, film-making co-operative, fast broadband and sustainable energy projects did their bit. Someone even built a sauna on a beach. The only snag, the committee admitted, was that Seaminster was fictional; it had completely made it up. But like the maybe-Banksys, if it was fake it was strangely convincing; a glimpse of what could happen given enough imagination. And who doesn’t long for them both to be real?
Councillors in Edinburgh have proposed measures to crack down on Airbnbs and other short-term lets in the city.
The council wants to create a “control area” where property owners must acquire planning permission to run a short-term let.
There has been a significant rise in such lets in Edinburgh – particularly on Airbnb – in the last five years.
Campaigners say this has exacerbated housing shortages and led to an increase in antisocial behaviour.
However, a body representing short-term let owners said the plans were “wholly disproportionate”.
More than a third of Scotland’s short-term let properties are believed to be in the capital, according to City of Edinburgh Council officials.
Under the proposals, council officers and councillors would determine whether a short-term let was suitable based on density, residential amenity and housing shortages in the area.
The control area would be city-wide and would not focus on the city centre and Leith where the majority of short-term lets are, because of fears this would lead to a high concentration of lets in neighbouring areas.
However, if a home has been continually used as a short-term let for more than 10 years before a control area is designated and no enforcement action has been taken during that time, planning permission would not be required.
Renting out a room in your house or letting your property whilst on holiday would also still be allowed.
Councillors voted to launch a consultation with the city’s residents at a meeting of the council’s planning committee. A final proposal will be sent to the Scottish government after the results of the consultation.
Separately, the Scottish government is currently consulting on legislation to introduce a licensing scheme for short-term let operators.
Campaign organisation PLACE, a network of Edinburgh residents fighting against short-term lets, said the lets often led to rent increases as well as disturbance from noisy parties, verbal abuse and damage to property.
“Neighbours of short-term lets are almost guaranteed to experience anti-social behaviour from customers,” a spokesperson added.
“Alcohol is a regular contributing factor which makes these situations particularly unpredictable and intimidating to deal with.”
However, the Association of Scotland’s Self-Caterers said the council had not provided evidence to back up the claim that short-term lets reduced available housing stock.
The organisation’s chief executive Fiona Campbell said: “Furthermore, their proposals appear to rely on pre-pandemic listings from one online platform only and this does not provide an accurate reflection of the situation.
“Self-catering properties have been a long-standing presence in the capital for decades, enhancing the tourist offering and boosting the local economy, and should not be used as a convenient scapegoat for policy failures elsewhere.”
Airbnb said it did not expect the proposed changes to affect the majority of its hosts.
However, Airnbnb director of public policy Patrick Robinson added: “We are concerned about the impact these measures could have on some hosts who bring great benefits to Scotland, and we look forward to engaging with Edinburgh City Council to secure the best outcomes for everyone.”
Another day, another example of priorities for Tory MPs – Owl
Shameless senior Tory Sir Geoffrey Cox trousered more than £900,000 working as a barrister while the Covid pandemic ripped through Britain – and failed to speak in Parliament once.
The former Attorney General has three second jobs as a barrister, including a lucrative role he began last September as “consultant global counsel” for Withers LLP with an annual salary of £468,000.
The MP for Torridge and West Devon last spoke in the Commons around 18 months ago – on January 16, 2020 – and stands accused of neglecting his constituents and being “missing in action” ever since.
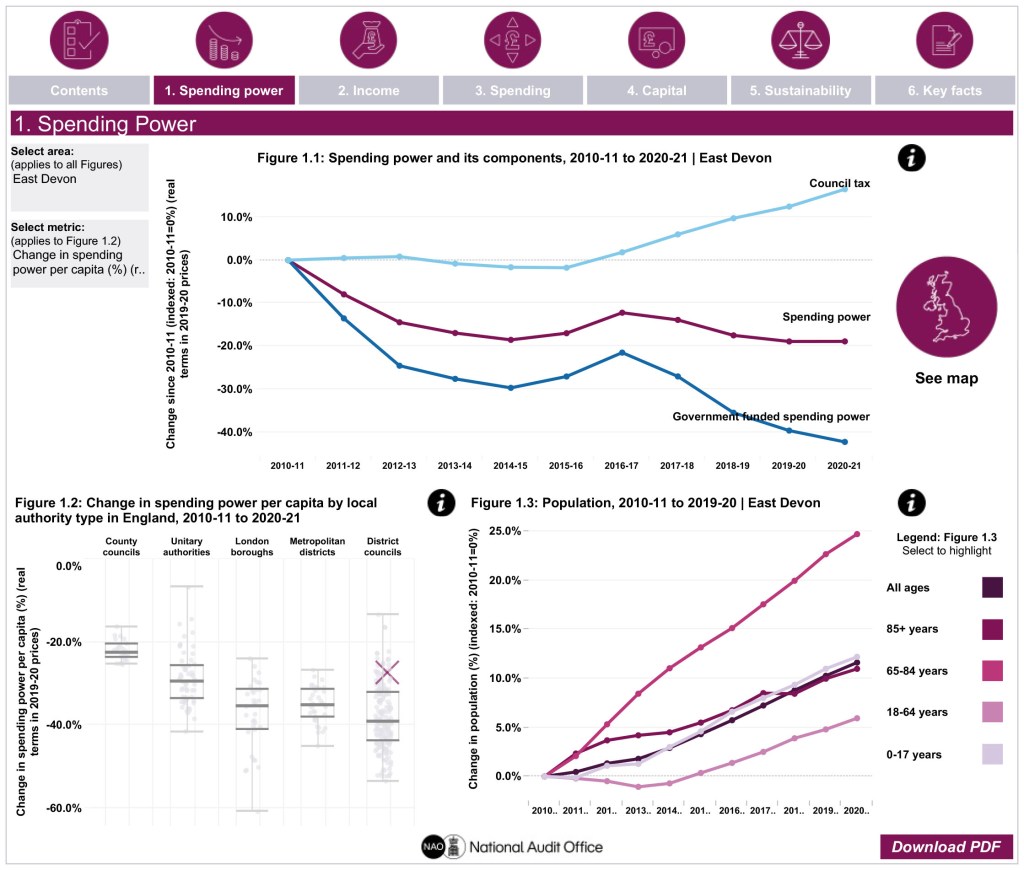
In the visualisation for a decade of data for East Devon you can clearly see the reduction of direct government funding and, despite the increase in council tax receipts, the net overall reduction in council spending power. (Fig 1.1).
You can see the switch in spending on highways, housing and the environment towards central services (Fig 3.1).
There is an interesting increase in capital expenditure charged to the revenue account in recent years (Fig 3.4).
There appears to be a curious gap in debt servicing costs around 2016 (Fig 5.3).
This is just to whet your appetite, there is a lot more to digest. – Owl
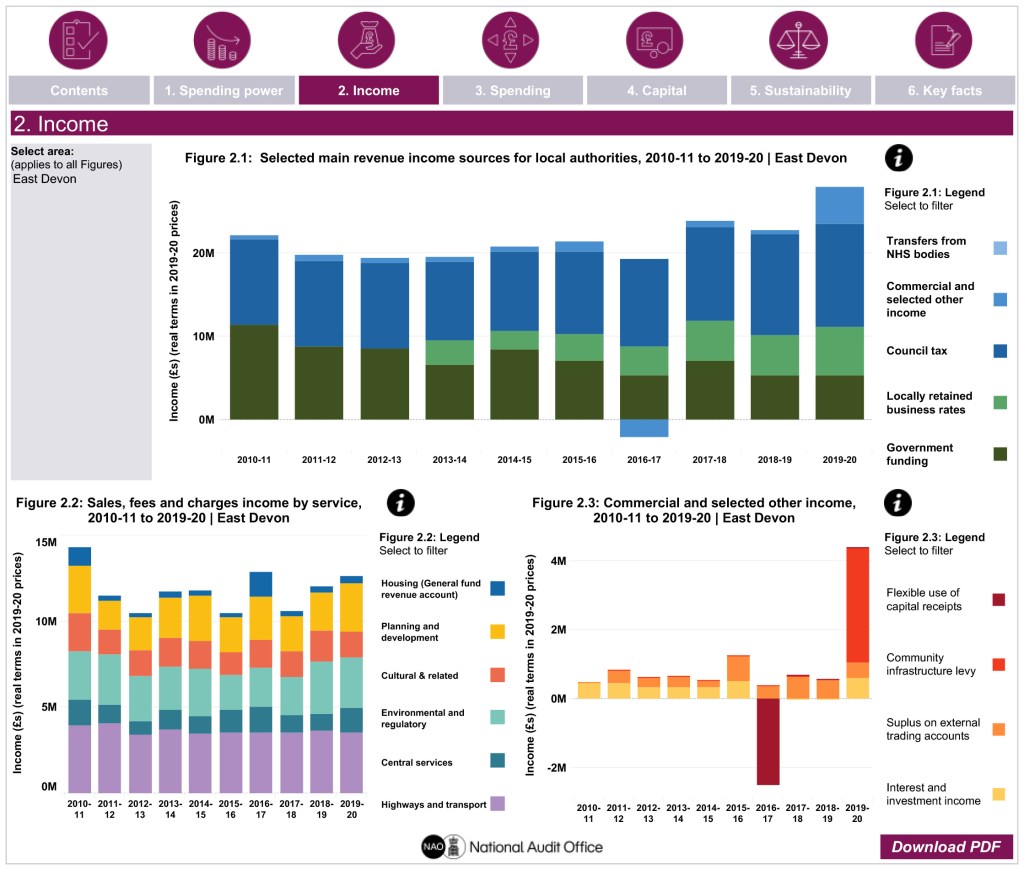
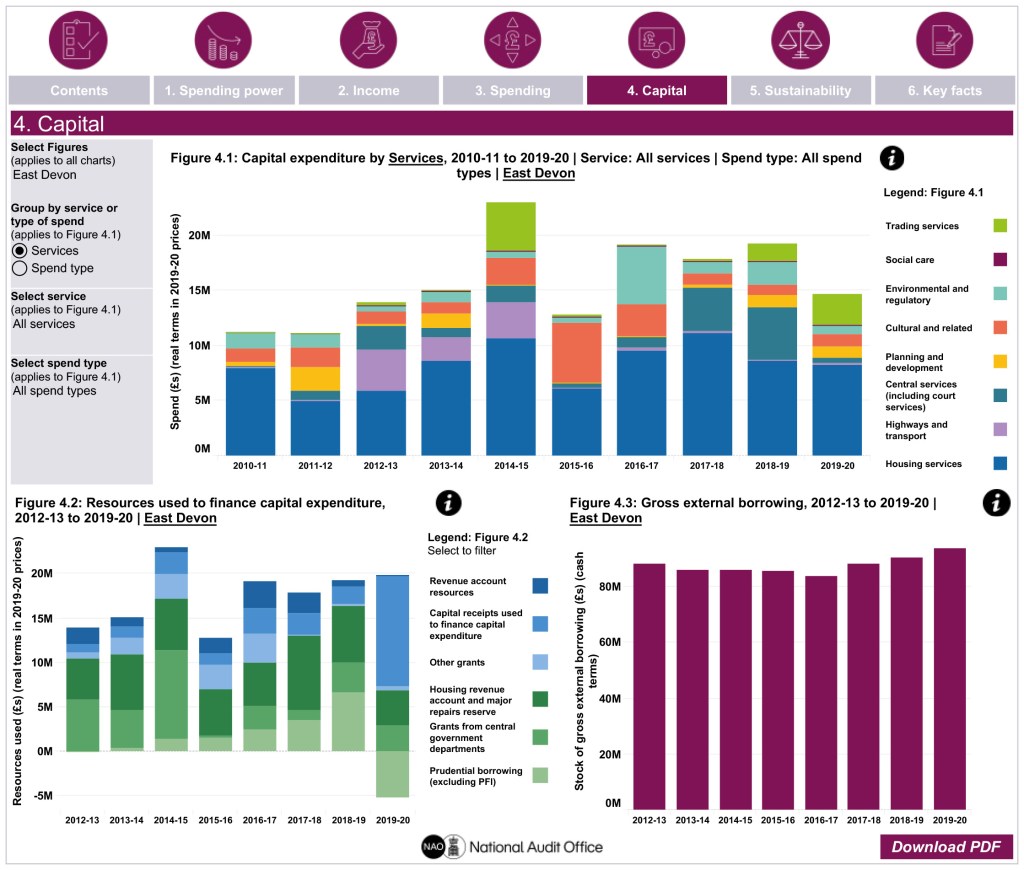
The data visualisation below describes changes in English local authorities’ financial circumstances over the last decade. [Owl has selected East Devon]
The analysis below does not cover the impact of the COVID-19 pandemic on local authorities’ finances. The national data required to undertake this analysis at the level of individual local authorities has not yet been published. However, our March 2021 report Local government finance in the pandemic sets out the pandemic’s impact at the national level.
While the pandemic has had a significant impact on authorities’ finances the fundamental patterns of financial restructuring over the last 10 years shown in this visualisation remain highly relevant. These trends shaped the financial circumstances of individual authorities and the sector as a whole entering the pandemic. They also represent the ongoing structural context that may need to be addressed in any future government reform of local government.
Key themes explored in the data visualisation include:
Reductions in revenue funding
Growth in some new and alternative income streams
Changing patterns of service spending
New capital investment strategies and associated risks
Changing patterns of financial sustainability
Purpose of the work
The objective of the visualisation is to allow you to explore the key trends identified in our recent reports in order to gain a more detailed and up-to-date understanding of the experiences of individual local authorities or groups of authorities.
The data we present show changes in income and spending alongside analysis of factors such as budget overspends and levels of reserves. These figures can change for a range of reasons such as local political priorities, changes in local demand and changes in government policy and priorities. Readers also need to bear in mind the differences in the functions and responsibilities of different types of authority. Consequently, comparisons between authorities need to be undertaken with caution. Overall, the complexity of factors underlying the data means that differences in figures presented here should not be viewed as indicative in any way of the current ‘performance’ of an authority. Any apparent differences between authorities should be seen as an opportunity to gather more information and build a richer understanding.
The data in the visualisation present a picture of the key trends affecting the sector and how individual authorities or groups of authorities compare to those trends. The analysis is not designed to identify specific authorities whose financial sustainability may be at risk. While the data in this visualisation are potentially relevant to an assessment of individual authorities’ financial sustainability they by no means represent a full assessment. Other data resources focused on financial sustainability, such as the Chartered Institute of Public Finance and Accountancy’s (CIPFA’s) Financial Resilience Index, are available.
Spending power: The Ministry of Housing, Communities & Local Government measures the impact of reducing government funding on local authority income via ‘spending power’. This indicator captures the main streams of government funding to local authorities alongside council tax.
Data in Figure 1.1:
Estimates of change in spending power: Due to regular changes to local authority duties and reporting arrangements since 2010-11 like-for-like comparisons over time are only possible if the data are adjusted to account for these changes. Each year the Department publishes an adjusted version of the year’s data that is comparable to the previous year, enabling comparison between pairs of years. We use this to create a chain-linked index for the years 2010-11 to 2019-20, in which pairs of adjusted years are linked by a weighting process. Because the data are weighted they will not match spending power and council tax data published by the Department precisely. We exclude Public Health Grant, the original Better Care Fund and other NHS health transfers from our analysis of spending power. For full details please see the standalone methodology from our 2018 report. Note that spending power does not include a measure of authorities’ above baseline retained business rates growth.
Government funded spending: Government funded spending power is defined as the grants and funding streams listed by the Department in any given year as components of spending power, with the exception of council tax, Public Health grant, and transfers from health bodies. This definition includes an assumed amount for 50% retained business rates.
Council tax: Data are taken from the spending power series published by the Department. The data are weighted through a chain-linking process and will therefore not match data published by the Department.
Demographic data in Figures 1.2 and 1.3: We use ONS local authority-based population estimates by single year of age from June 2021. We group these data into age bands in Figure 3.3. The data were sourced from NOMIS. For the per capita analysis of change in spending power in Figure 3.2 we use the total population data in Figure 3.3.
Dashboard 2 – Income
This dashboard shows a broader set of revenue income streams than those shown in the spending power data in Dashboard 2. While spending power is the Department’s preferred measure of revenue income, it is nonetheless informative to set out this wider set of income streams available to local authorities to fund service provision.
Data in Figure 2.1:
Government funding includes redistributed non-domestic rates, revenue support grant, area-based grant, local service support grant, and special and specific grants inside aggregate external finance (excluding schools grants). We exclude public health grant. We include a broader range of government grants than in spending power. We also do not weight the data to address any year-on-year discontinuities. As such the figures for government funding in this Figure are not directly comparable to those in the spending power dashboard. We do not include COVID-19 grants received by local authorities in late March 2020.
We show NHS transfers to support adult social care. These are taken from NHS Digital’s PSSEX and ASC-FR data.
We show income from locally retained business rates. In contrast to spending power data this will include retained income from above baseline business rates growth. Data are from the Department’s RS return.
Council tax figures are not comparable to those in the spending power dashboard which have been weighted to address year-on-year discontinuities. A key issue is the switch from council tax benefit to council tax support in 2013-14. Funding for council tax benefit forms part of council tax income prior to 2013-14 in Figure 2.1. Funding for council tax support from 2013-14 onwards appears in government funding.
Commercial and selected other income includes four income streams. We include surpluses/deficits on trading services accounts (gross of capital charges) and interest and investment income. We also include levels of the flexible use of capital receipts by local authorities. For a temporary period, government has allowed local authorities to use capital receipts to meet the revenue costs of transformation programmes. Under normal circumstances capital receipts are generally only available to fund capital investments. Finally, we include income received from community infrastructure levies.
Data in Figure 2.2: We show sales, fees and charges income for each named service area. Income generated through sales, fees and charges in a particular service is used to support the further provision of the service in question. Data are taken from the Department’s RSX form. We include an estimate of non-schools education sales, fees and charges income. This is based on our estimate of spend on non-schools education (see methodology section on Dashboard 3 below). We calculate our estimate of non-schools education spend as a share of total education services spend in any given year. We then apply this figure on a pro-rata basis to education services sales, fees and charges income to calculate an estimate for non-schools education sales, fees and charges. We recognise that this pro-rata approach is unlikely to reflect the actual distribution of sales, fees and charges income between non-schools and schools spending precisely, but any alternative approach is likely to be excessively complex for our purposes.
Data in Figure 2.3: We include surpluses/deficits on trading services accounts (gross of capital charges) and interest and investment income. We also include levels of the flexible use of capital receipts by local authorities. Finally, we include income received from community infrastructure levies.
Dashboard 3 – Service and non-service spending
Default data are shown for change in net spend. Net current expenditure is funded by an authority’s own resources, such as business rates, grants and council tax. This is in contrast to total spending which includes net spending but also includes spending supported by other sources of income. This includes income from sales, fees and charges or ‘other income’ such as transfers from other public bodies.
Net spend can fall due to both reductions in total spend and increases in income. Growth in income reduces the need for authorities to use their own resources (which registers as net spend) to support spending. In some instances, an authority may register negative net expenditure in a particular service area. This means that its income has outstripped its net spend in that year. Negative net expenditure is effectively net income. In our analysis of change in spend over time by service area, where an authority has experienced an increase in net income (i.e. its income outstrips total expenditure more in the second period than the first), or where it has moved from a position of positive net spend to net income, this will show as a decrease in net spending in the visualisation. Where an authority moves from net spend in 2010-11 to net income in 2019-20 this will show as a reduction of over 100% in net spending in the visualisation in Figure 3.1.
Sales, fees and charges income into Figures 3.1 to 3.3: We include the option to show the data in these charts either not or gross of sales, fees and charges income. However, we do not include service spend funded by ‘other income’. This income line includes recharges and as such creates the risk of double counting.
Highways and transport data in Figure 3.1 to 3.3: There is a discontinuity in the data for district and county councils in 2011-12 due to the transfer in concessionary fares between these two types of authorities. Responsibility, and the associated funding, for concessionary fares in two tier areas was transferred from district to county councils. This has the effect of reducing net spending for many district councils from 2011-12. As a result, from 2011-12 onwards for many district councils, sales, fees and charges income in highways and transport exceeds the level of net spend funded from their own resources. This is shown in the data visualisation as negative net spending, or net income. Where an authority moves from net spend in 2010-11 to net income in 2019-20 this will show as a reduction of over 100% in net spending in the visualisation in Figure 3.1.
Data in Figures 3.1 and 3.2:
All data are taken from the Department’s RS data return. We do not show data in Figure 3.1 for housing services and planning and development spend for county councils. These authorities do not have (significant) responsibilities in these areas and therefore only record minimal, if any, spend. Presenting this in Figure 3.1 which shows percentage change, could be potentially misleading. However, we do include this residual spend in Figures 3.2 and 3.3 (and Figures 5.2 and 5.4). Similarly, in Figure 3.1 we do not include the spend recorded by a small number of district councils on adult or children’s social care as they do not have statutory responsibilities for these services. However, in contrast to county councils, we do not include this spend in Figure 3.2, 3.3 or anywhere else in the data visualisation. The sums recorded by district councils in these areas are not material and are potentially confusing.
Adult social care spend: We adjust this data to include an estimate of funding transferred from NHS bodies to local authorities to support adult social care. This is necessary not only to capture income provided through funding lines such as the original Better Care Fund but also to capture Valuing People Now transfers in 2010-11. We use data on NHS transfers to individual local authorities contained in the PSSEX and ASC-FR data sets published by NHS Digital. These local authority level figures are slightly higher than the national totals NHS Digital publishes for the key NHS transfers relevant to our work, suggesting that the local data also contains other NHS transfers. However, the local data are broadly in line with the scale and direction of travel of the national data on key transfers. In our assessment the adjusted data provides a more accurate view of the resources used by local authorities than the unadjusted data.
Children’s social care spend data has been adjusted. In 2014-15 a number of sub-service spending lines were moved in the data returns from education services to children’s services. In order to ensure consistency over time we move these two sub-services – Sure Start and services for young people – from our children’s services figures back into education services from 2014-15 onwards. This adjustment applies wherever children’s social care spending appears in the data visualisation.
Non-schools education spending includes spend recorded under the education services line in the Department’s RO data returns. However, we have stripped out spending by schools and spending passed through local authorities to support adult education. We add spending on Sure Start and services for young people into this line from 2014-15 onwards to enable a like for like comparison over time. For full details and caveats please see the standalone methodology that accompanied our 2018 report. In a small number of cases our adjustments create anomalies in individual years for individual authorities. We address these by replacing the adjusted data for the years in question with interpolated data based on the preceding and subsequent years. This metric is an estimate and needs to be used with caution. However, we feel there is value in including it in our analysis as there is a clear imbalance between change in income and change in spending as reported in the RS if it is excluded.
Highways and transport and environmental and regulatory services: We include levies paid by authorities to passenger transport authorities and combined authorities, and waste disposal authorities in the relevant service lines.
Housing services: In line with the RS form, we only show revenue spend from the general fund revenue account (GFRA). We do not include revenue spend from the housing revenue account (HRA).
Spending on public health is excluded: Local authorities were given public health responsibilities in 2013-14. Given the complexities of including this activity for only an element of the data visualisation’s time period we exclude this spending from this dashboard and across the data visualisation as a whole.
Data in Figure 3.3: ‘All services’ includes all the services listed in Figure 3.2 for each authority. For single tier and county councils, social care spend includes adult and children’s social care. Non-social care includes all the remaining service areas listed in Figure 3.2 for each authority. Figure 3.3 includes an option to view the data for ‘all services’ on a per capita basis. We use the total population data presented in Figure 1.3.
Data in Figure 3.4: We include capital expenditure funded from the revenue account (CERA) (excluding public health CERA), minimum revenue provisions and interest payments (adjusted for HRA item 8).
Dashboard 4 – Capital
All data are taken from the Department’s annual capital outturn return (COR) data set.
Data in Figure 4.1: We show total capital expenditure by service area and type. This includes total expenditure on fixed assets and total financial expenditure. We exclude ‘other transactions’. We do not include capital expenditure on education services and some other service areas. Housing spend is funded from the general fund revenue account (GFRA), the housing revenue account (HRA) and the major repairs reserve.
Data in Figure 4.2: These data include capital spend on all service areas as it is not possible to identify individual service areas within this data. As such, these data are not directly comparable with Figure 4.1 which excludes education and some other service areas. Data on prudential borrowing refers both to spend supported by external borrowing, and also to spend funded by internal borrowing. This is a treasury management practice whereby an authority delays the need to borrow externally by temporarily using cash it holds for other purposes, such as insurance funds held in earmarked reserves. The chart starts in 2012-13 rather than 2010-11 in order to avoid the discontinuity created by the localisation of authorities’ housing revenue accounts in 2011-12.
Data in Figure 4.3: We show the stock of gross external borrowing as of 31 March in each year. Data are from the COR in cash terms. The chart starts in 2012-13 rather than 2010-11 in order to avoid the discontinuity created by the localisation of authorities’ housing revenue accounts in 2011-12.
Dashboard 5 – Financial Sustainability
We show a selection of measures of financial sustainability drawn from across our recent studies. While these provide some insight into the financial sustainability of authorities, they do not represent a full analysis.
Data in Figure 5.1: We show data for unallocated and earmarked reserves. We exclude public health, schools, and dedicated schools grant (DSG) reserves. We show data as a share of our chain-linked measure of spending power. Net revenue expenditure is our preferred denominator, but inconsistencies in the way that some authorities have recorded data in the RO over this period mean that this metric is not sufficiently stable. Our weighted spending power timeseries provides a similar, but more stable measure. The main data we show for reserves are as reported by local authorities and published in the RO.
We also include an option to view an adjusted measure of authorities’ reserves. In late March 2020, local authorities received additional funding to support their COVID-19 response. Given this proximity to the end of the financial year, this funding was not necessarily spent in 2019-20 and some authorities included it within their 2019-20 end of year reserves. This has the effect of seemingly inflating some authorities’ reserve levels in that year. We therefore provide an adjusted measure of reserves that seeks to strip out this additional funding from authorities’ reserves. We do this by subtracting the value of the COVID-19 grants from authorities’ earmarked reserves as of 31 March. In recognition of the fact that not all authorities recorded this grant funding in their reserves however, we use the authorities’ estimates of their reserves as of 1 April 2020, as reported in their RA budget returns, as a benchmark. The RA returns were submitted before the 2019-20 RO return, and unless specified in the return, reflect authorities’ budget planning before COVID-19 and the associated grant funding were a significant feature. If our adjusted earmarked reserves figure from the 2019-20 RO is below an authority’s estimated earmarked reserves for 1 April in its 2020-21 RA return we assume that the authority did not record their COVID-19 grants in their reserves, and we therefore do not adjust their RO figures. There are a small number of authorities that state in their 2020-21 RA that they have adjusted their reserves to reflect COVID-19 grants. For these authorities we assume that these grants were also in their reserves in their 2019-20 RO return, and therefore we have adjusted their 2019-20 earmarked reserves. Clearly our figures are estimates and need to be treated with caution, and we would recommend that readers engage with local information sources such as authorities’ annual accounts. Nonetheless we think they are worthy of inclusion as there is a risk that the sector’s reserves are over-stated otherwise.
There is a further discontinuity in the reserves data timeseries in this data visualisation. In 2018-19 the Department asked single tier and county councils to identify dedicated schools grant (DSG) reserves separately in their reserves data. Some authorities had previously recorded this data in their schools reserves. However, we estimate that around a third of authorities had previously recorded their DSG reserves in their earmarked reserves and a further small number in their unallocated reserves. The fact that these authorities have now started recording their DSG reserves separately creates a potential discontinuity in our data series for earmarked and unallocated reserves. It would be possible to adjust for this by adding DSG reserves back into these authorities’ reserves from 2018-19 onwards. However, this would create two separate and non-comparable groups of authorities in this period, one with DSG reserves in their earmarked and/or unallocated reserves and one without. Given this, as well as existing complexities around the COVID-19 grants’ impact on reserves and the fact that in most cases the DSG discontinuity is not material for individual authorities, we have not included this adjustment in the data visualisation. However, readers should bear this potential discontinuity in mind when considering the reserves timeseries for single tier and county councils.
Data in Figure 5.2: We show outturn against budget data for all the services shown in Figure 3.2 for each authority. However, we exclude non-schools education and we do not include NHS transfers in our measure of adult social care spend. Budget data for these two figures is not available. We start the time series in 2011-12 as budget (RA) data are not comparable with outturn (RO) data at the service level in 2010-11. The metric shown is the difference between outturn and budget spend calculated as a percentage of an authority’s overall service budget. A positive figure indicates that the level of outturn spend exceeds the planned budget spend – an overspend. For single tier and county councils we include the option to focus separately on adult social care, children’s social care and spending on all other service areas (as defined in Figure 3.3). For each of these three service areas we show the variation between outturn and budget as a share of that specific service area’s budget.
Data in Figure 5.3: We include interest payments (adjusted for HRA item 8) minimum revenue provision and leasing payments in our measure of debt service costs. We use our chain-linked measure of spending power to standardise the data (see notes on Figure 5.1).
Data in Figure 5.4: We show spend on adult and children’s social care. We adjust adult social care to include estimated transfers from NHS bodies. The all services denominator includes all the service areas shown in Figure 3.2.
Dashboard 6 –Key Facts
All data shown in this dashboard are taken from Dashboards 1 to 5.
“The Conservative Party is the party of aspiration and opportunity for all, no matter your gender, your ethnicity or where you come from.” – Great quote, Owl.
Two of Boris Johnson’s closest advisers were being lined up for leadership roles in the Middle East outreach group at the heart of a dispute that has shaken Tory high command, The Times can disclose.
Lord Udny-Lister, the prime minister’s former chief of staff, and Baroness Finn, his present deputy chief of staff, were in talks to take senior roles with Conservative Friends of the Middle East and North Africa (Comena).
Comena is being set up by Mohamed Amersi, a telecoms millionaire and Conservative donor who made incendiary claims at the weekend about Ben Elliot, the party chairman. The group has applied for formal affiliation to the party and is being formed to develop its links to Middle Eastern countries.
Amersi’s close links to such senior Conservatives will make it harder for the party to distance itself from him after his assertion that Elliot had fostered a culture of “access capitalism” at the heart of the establishment.
Udny-Lister, who served as the prime minister’s special envoy to the Gulf before he left government in April, was to become one of Comena’s vice-chairmen, according to documents seen by this newspaper. He said he had agreed to be involved but did not recall agreeing specifically to accept a vice-chairman role.
Finn was approached about taking a role before she joined No 10 but the discussions never led to formal agreement and she never reached the stage of seeking permission from Downing Street. A friend said: “Simone was approached to join the advisory council but this was not progressed.”
Theresa May was to be a patron. A spokeswoman for the former prime minister confirmed that she had agreed to this but added that she was no longer involved with the organisation.
According to documents seen by The Times, other Tory politicians who were being lined up for leadership positions included Lord Johnson of Marylebone, the prime minister’s brother, Sir Hugo Swire, the former Tory minister, the MP Mark Garnier and Lord Lamont of Lerwick, the former chancellor.
Amersi’s list of supporters was subject to Comena becoming affiliated to the party and the parliamentarians declaring their interests in the Commons and Lords registers.
Garnier said he had agreed to be vice-chairman of the group “subject to Comena achieving affiliate status with the party and then moving forward into a properly structured organisation”. Lamont said he had agreed to be a vice-president about six months ago but that progress had stalled. Neither Johnson nor Swire responded to requests for comment.
At the weekend Amersi claimed that Elliot benefited from giving wealthy clients of his company access to the Prince of Wales. Amersi said Elliot had introduced him to Prince Charles in 2013 after he paid thousands of pounds for elite membership of the Tory chairman’s concierge company, Quintessentially. A spokesman for Elliot said the introduction was “entirely about helping to raise money for charity”.
Amersi told The Daily Telegraph last night: “I highly regret that Prince Charles has been involved in this.” He became a leading figure in several of Charles’s charities, including Prince’s Trust International.
Last night Amersi also claimed that he would have been treated better by the Conservatives if he had was white. He told The Daily Mail: “I sometimes wonder if I was white and my surname was John Smith and I had been to Eton and Oxford I might have been treated differently. And I think there is some truth in that.”
A party spokesman said: “The Conservative Party is the party of aspiration and opportunity for all, no matter your gender, your ethnicity or where you come from.”
Comena was to rival the Conservative Middle East Council, which is led by Charlotte Leslie, the former MP for Bristol North West, but severed its formal ties to the party in 2019.
From Mike Temple (upgraded from comment to full post)
I’m a Red Grouse, a High-Class Bird, Of all Game-Birds the one preferred By gentry, lords and the top brass, All members of the ruling class.
I’m courted by the richest in the land Who make damn sure Grouse-Shooting isn’t banned. I live amongst the purple moorland heather Where noble folk and I can come together.
Yes, I’m well-bred, a highly favoured Grouse, Like Eton Boys and chaps from Charterhouse, For that is where all those chaps born to rule Are sent away from home to public school.
It’s there they learn to tell a clever lie, Their feelings only for the Old School Tie. I play my part to see the rich have fun, A leading role, together with the Gun.
The Glorious Twelfth is my great Day. I’m centre-stage in that display. I look down on all other Game; Pheasants and I are not the same.
We meet with low-class Beaters on the heather, For Grouse-Shoots bring the classes close together And those who normally get little pay Can now earn a cool fifty quid a day. (No matter if their noble “chum” Should miss and shoot them in the bum.)
They flush me out. I fly up in the sky. Bang, bang! I’m hit. I topple and I die And then I’m roasted on an open fire. What greater Glory could a Grouse desire?
Public health bosses put the spike down to “greater social mixing” – How’s your pub crawl going Simon? – Owl
From today’s Western Morning News.
Public health bosses say they have no evidence a rise in coronavirus infection rates which has led to record case levels in Devon is down to an influx of holidaymakers.
Exeter has the second highest infection rate in England, while rates in Devon currently stand at 335 per 100,000 – only just below the peak seen in July.
Suggestions had been made that the rebound in case rates could in part be down to the surge of tourists visiting the Westcountry.
However, a spokesperson for Public Health Devon dismissed the rumours and instead put the rise in cases down to greater social mixing following the relaxation of Covid restrictions on July 19.
“There is no evidence to suggest that the rise in cases is attributable to holidaymakers visiting Devon. We are seeing a rise in positive cases, and that is to be expected as more people mix socially,” they said.
Exeter has recorded 780 positive cases of Covid-19 in the last week of available figures, predominantly among younger working age people. An infection rate of 583 per 100,000 in the city was the second highest in England after Lincoln.
In Cornwall the busy holiday resorts of Falmouth and Penryn are experiencing high case rates. It comes after Newquay saw Cornwall’s largest spike in figures last Tuesday, with a case rate of 577 per 100,000.
Public Health Cornwall says the rise in cases is down to a combination of factors, including the lifting of restrictions and increased transmissibility of the Delta variant.
Meanwhile, Plymouth has seen 1,162 new infections in the past week as the case rate rises.
NIMBY is an acronym for the phrase ‘Not In My BackYard’, which is a characterization of opposition by residents to proposed undesirable developments in their local area.
Large development companies often use this colloquialism in a derogatory sense, labelling NIMBYS as obsessive, ‘nerdish anoraks’ for blocking housing, economic and employment growth benefits, lacking forward-thinking and fearing changes to the identity and character of their neighbourhoods.
However, in reality NIMBYS usually are normal, ordinary people who have a very strong sense of what is right and what is wrong, are often open-minded to innovative, progressive development that will enhance communities but will not tolerate over-development and inappropriate designs just to ‘line the pockets’ of development company directors and shareholders!
For centuries people have identified that ‘An Englishman’s Home Is His Castle’ – so most would agree that their homes are a sanctuary, an oasis and a shelter from undesirable encroachment, with any invasion being vehemently defended.
So it is no surprise that, when inappropriate development is proposed directly in their back yards, that they will oppose any detrimental effects and they will summon those who have been elected as decision-makers at East Devon District Council (EDDC) to ensure that firstly they represent the people who will be substantially affected by this development and secondly that they make the correct judgement on the density and designs of homes that will remain in this historic, rural community for several lifetimes!
The precedent for this development ship has already sailed with the approval in December 2020 by EDDC Planners of the Outline Hybrid Application (20/1001/MOUT) commending the economic benefits of 2,000+ jobs alongside up to 94 housing units in a village community that actually has no local housing need.
However, the majority of the proposed housing directly overlooks existing residents’ homes and back gardens, from not only a green field open space (Zone A) historically outside of the Local and Neighbourhood Plans but also from 40 towering four-storey apartment blocks on brownfield land (Zone D) opposite a Grade II* listed Manor House.
The present Reserved Matters plans appear to show a welcome reduction in the Zone A green field housing but unfortunately the Zone D proposals still contain three blocks of 40 four-storey apartments, with an access road (serving a minimum of 80+ apartment vehicles) directly in line with the boundaries of existing residents’ homes, making them vulnerable to excessive vehicle noise, air and light pollution. However, a worthless, ‘spitting in the wind’ politically-correct ideal showing ‘grass-roofed’ covered parking for the apartments is also planned to ‘green up’ and mitigate the intense, substantial harm of such over-development in this countryside location.
These urban apartment proposals fail to promote sympathetic, considerate, neighbourly designs in a rural community and display a harmful intensity and over-development of the brownfield site and require a major rethink before they will persuade NIMBYS to become YIMBYS!
We’ve just started a collaboration with the brilliant folks at Good Law Project.
First up, a six-minute film on the jaw-dropping story of the secret back-channel that allowed friends of the Conservative Party and other politically-connected suppliers to secure billions of pounds of PPE contracts.
We projected it late last night on Parliament – it’s a film that everyone in the country should see (huge thanks to Gavin Esler for providing the voice over).
The crisis in social care in the UK does not have just one cause, nor one simple solution. Chronic underfunding, an ageing population, the Brexit-induced labour shortage and the devastation wreaked by Covid-19 have all played a part. But the problems forcing the care system to the brink of collapse don’t just come from a series of exogenous shocks – they are internal too. The very structure of the sector is unstable.
Christine Corlet Walker (a researcher at the Centre for the Understanding of Sustainable Prosperity) www.theguardian.com
The growing involvement of private equity, hedge funds and real estate investment trusts in the care sector in recent decades has brought about a rise in the use of predatory financial techniques, justified in the name of enticing capital into a sector that the government has persistently failed to adequately fund. According to data from the Care Quality Commission, these firms now own one in eight care home beds in England.
A screen of financial jargon helps investors avoid public scrutiny, but a slew of recent reports has begun to detail the many tactics used to ensure “healthy” returns on investment – and the profound and troubling consequences that these strategies have for the care sector.
In 2012, the UK-based private equity firm Terra Firma Capital bought Four Seasons Health Care in an £825m debt-leveraged buyout, backed by US-based hedge fund H/2 Capital Partners.
Leveraged buyouts are a common technique used to increase return on investment. They allow investors to pay only a fraction of the purchase price using their own capital; the rest is covered with a loan. In theory, the target social care company then pays off the debt using their cashflow, increasing the equity portion owned by the investment firm, meaning a larger windfall for investors if the care company is sold on.
However, recent research has found that these kinds of buyouts are associated with an 18% increase in risk of bankruptcy for the target company. In the case of Four Seasons Health Care, onerous debt payments contributed to the company’s collapse into administration in 2019. Two of the other largest care home providers in the UK – HC-One and Care UK – have also undergone leveraged buyouts and, as a result, their corporate group structures remain saddled with significant debts.
The implications of this debt-heavy model are significant. Among the five largest care home chains backed by private equity in the UK, interest payments on leveraged buyouts and other debt obligations absorb about 16% of the average weekly bed fee.
But interest payments on debt aren’t the only additional cost some care providers face. Other strategies for increasing return on investment see investors selling off care home properties for a one-off lump sum, then leasing them back – sometimes from a new landlord, sometimes from other entities within the corporate structure.
Care UK’s accounts, for example, state that it paid £4.1m in rent in 2019 to Silver Sea Holdings – a company registered in Luxembourg, a low-tax jurisdiction, which is also owned by Care UK’s parent company, Bridgepoint.
These financialised structures demand an ever-growing revenue stream, not to fund more and better quality care or higher wages, but to keep up with growing interest repayments on the debts they carry and rising rents, and to line the pockets of investors, some of whom are astutely located in low-tax jurisdictions.
Current reform proposals do not even begin to touch these problems. The touted 1p increase on national insurance contributions to fund social care, while welcome, would be like pouring money into a bucket that someone has wilfully punched holes into. We have to stem the outflow too.
Tighter financial regulation of the sector could rein in extractivist financial practices, and in the short term should be used to do so. However, this misses an even more fundamental challenge: that the core characteristics of adult social care make it almost impossible to privatise successfully. The supposed benefits of the free market – quality innovations and cost efficiencies – simply don’t apply. The bucket itself is not, and never has been, structurally sound.
For starters, well-functioning markets rely on consumer choice: if a product or service is inadequate, you simply choose another. But unlike a phone contract, where poor service may inspire you to switch provider, the physical and emotional costs associated with moving between care homes – known as “transfer trauma” – can leave vulnerable residents with limited power to voice their concerns.
In addition, the time-insensitive nature of care work means that there are few opportunities for cost-efficiency savings without compromising working conditions and quality of care. After all, asking a care worker to spend less time with each client can only be detrimental for a service in which, as the economist Tim Jackson puts it, the “quality rests entirely on the attention paid by one person to another”.
These two features of the care sector mean that service quality and worker pay come into conflict with returns to investors. Independent studies appear to corroborate this, finding that both quality of care and wages are generally lower in for-profit care homes.
Signing-on bonuses to recruit new carers, piecemeal funding reforms and even improved financial regulation cannot scratch the surface of these structural challenges.
The competitive, for-profit model of social care provision has had 30 years to deliver on its promises of efficient, high-quality services. In that time, the crisis in adult social care has only deepened. Instead of driving innovation, increased competition between providers has undermined care quality. It is time to stop pursuing the same strategy and expecting a different outcome.
The care sector needs an overhaul. Not only do we need adequate long-term funding from central government, we also need to address some searching questions about the role of profit in the sector, and ask: who is benefiting from this dysfunctional model? And who, ultimately, is paying the price?
The end of lockdown has come too late to prevent fresh store closures on Britain’s high streets as businesses count the cost of 18 months of pandemic disruption, the latest update on consumer spending has shown.
Despite a boost to activity after the lifting of restrictions, the trade body for the sector, the British Retail Consortium, said the pace of recovery was slowing and more town centre sites were falling vacant.
The BRC said reform of business rates was vital to ensure investment in bricks-and-mortar retailing amid signs of a permanent shift towards online shopping during the Covid-19 crisis.
Its monthly retail sales monitor showed annual sales growth of 6.4% in July, well down on the three-month average of 14.7%.
Helen Dickinson, the BRC’s chief executive, said: “July continued to see strong sales, although growth has started to slow. The lifting of restrictions did not bring the anticipated in-store boost, with the wet weather leaving consumers reluctant to visit shopping destinations.”
Dickinson added that online sales remained strong, with the BRC figures showing a digital penetration rate of just under 50% for non-food items, up from 30% two years ago.
“Many shops and local communities have been battered by the pandemic, with many high streets in need of further investment,” the BRC chief executive said.
“Unfortunately, the current broken business rates system continues to hold back retailers, hindering vital investment into retail innovation and the blended physical-digital retail offering. The government must ensure the upcoming business rates review permanently reduces the cost burden to sustainable levels.
“Retailers want to play their part in building back a better future for local communities, and government must give them the tools to do so.”
Separate figures from the credit card company Barclaycard showed shops may have suffered from consumers spending more of their money on going to the cinema, theatre and sporting events.
Barclaycard said spending on its cards was 11.6% higher in July than in the same month two years ago as people took advantage of their “newfound freedom”. Entertainment experienced its first growth since the pandemic arrived in the UK in early 2020.
Raheel Ahmed, Barclaycard’s head of consumer products, said:“July’s major sports fixtures and the heatwave kept the nation in good spirits, providing more reasons to celebrate together, and giving the entertainment industry its long-awaited boost back into growth.
“While some sectors took a small step back as the post-lockdown ‘honeymoon’ period cooled, July was a positive month overall. However, with inflation expected to rise, it will be interesting to see how this impacts consumer spending behaviour over the coming months.”
The retail specialists Springboard said high street footfall continued to grow in the first week of August, rising by 1.4%.
A concerned resident writes in the Sidmouth Herald:
Closure of The Ham Path/Cycleway to the Public, for the proposed Jazz and Blues Festival, 2022:
The Sidmouth Town Clerk, the Chairman and Sidmouth Town Councillors have allowed The Ham path/cycleway to be closed to the public.
During the proposed Jazz and Blues Festival for 2022 the plan is for the path/cycleway to the Esplanade to be closed for the 7 day duration of the Festival.
The Festival proposes to fence off the path/cycleway and the whole of the grassed area of The Ham preventing public use.
(They also propose to have the Alma Bridge ‘boarded off’ to prevent viewing from the bridge).
Concerns are raised about access and mobility issues which will be caused for those who cannot easily be diverted and go around and over the small bridge, along the riverside path: those who are frail, disabled, in wheelchairs or with motorised wheelchairs, as well as those cycling or walking to and from the seafront.
The small bridge to the riverside can be a dangerous hazard.
An excessive 2,000 people are expected to attend the proposed Jazz and Blues Festival on The Ham (1,000 more than the Folk Week Marquee accomodates) adding increased access and safety issues to, and from, the Esplanade and Town.
Festival traffic, pedestrian and motorised traffic of all sorts will be channelled, dangerously, through York Street and around The Ham area itself.
The Ham path/cycleway has never been cut off from Public use in living memory.
Sidmouth Town Council have provided no information about this Festival plan, or it’s consequences, or that it is going to EDDC Licensing Committee.
The Application Notice asking for Objections is not easily seen by the Public-one was placed (out of the way?) in the corner of The Ham where few people go-; the Site Plan which shows the details of what is proposed, has to be requested and has been difficult to obtain from EDDC Licensing (the Organiser said they weren’t able to provide it to local residents- it is on one sheet of paper). The view from the EDDC Licensing Manager is that it is up to the Organiser to decide where they put the Application Notice to inform the Public of their proposals.
A second letter on this matter was sent to local residents. This had been the opportunity for Sidmouth Town Council and the Festival Organiser to be open and transparent with local residents and Sidmouth Townfolk about it’s plans: it has failed again to do this.
Many Sidmouth residents are unaware that this is proposed and the difficulties it will cause to many.
With increased demand due to the higher number of visitors in Cornwall and Devon combined with the pressures of Covid-19 and shortages in staff there have been reports of all health services coming under sustained pressure.
The South Western Ambulance Service issued a desperate plea to the public earlier this month, urging them to only call 999 for life-threatening emergencies.
The warning came after the service said it was experiencing “extremely high demand.” The service had its busiest week on record in July, responding to a total of 22,041 incidents across seven days.
The pressure on the ambulance service has seen queues of ambulances outside the Royal Cornwall Hospital in Truro and other hospitals in the region.
Now, in a bid to support paramedics and other ambulance staff, military personnel will be assisting in the region.
Wayne Darch, South Western Ambulance Service’s assistant director of operations, said: “With the NHS in the South West facing increasing demand we are using tried and tested methods to alleviate pressures on services so everyone will continue to get the care they need.
“This includes a small number of military personnel to help us get more of our vehicles back on the road, getting people the urgent care and treatment they need sooner. If you are worried about your health but it is not an emergency, please use 111 online to be directed to the best service for your needs.”
John Humphreys, aged 59, of Hartley Road, Exmouth, on trial at Exeter Crown Court, denies ten charges, alleged to have taken place between 1990 and 2002.
The court heard Humphreys denies ever having any sexual activity with either of the boys.
Humphreys stands accused of two charges of indecent assault and three counts of a sex assault on a boy aged 12 to 13 between 1990 and 1991.
He is also charged with five further counts of indecent assault of a second boy aged 14 to 15 between 1999 and 2002.
Prosecutor Mr Piers Norsworthy told the jury the younger boy said he met Humphreys in a public toilet and allegedly went on to have sex with him on three occasions; in a flat in Exmouth, and once in a stone building ‘that stank of pee’ in a Woodbury Common car park.
In a video interview played to the court, the male told police: “He took me into the apartment and made me do stuff that I didn’t want to do, and he shouldn’t be doing with a young boy.”
He said Humphreys was ‘aggressive’ when pushing him up against the wall of a stone building on Woodbury Common to have sex.
The male added: “He wiped himself all over my school shirt. I was thinking ‘my mum will kill me’.
“I took my school shirt off. I remember thinking ‘I don’t know how the washing machine works, so how am I going to explain this?’.
“I don’t know how I did any of it. The pain was unbearable. I thought I was going to die. I just couldn’t stop it.”
The court heard the second boy alleged Humphreys made him feel ‘dirty’, touching him sexually, and making him reciprocate, while in a flat while he was on work experience in Exmouth, telling the teenager: “This does not mean you are gay.”
Mr Norsworthy said the two complainants, both now adults, went to the police independently of each other.
The older boy went to Exmouth police in August 2004 and Humphreys was interviewed in October 2005, the court heard.
It was more than a decade later that the other boy went to police and the earlier complaint was reviewed, the jury was told.
Mr Norsworthy said the investigation had been ‘lengthy’, adding gardening contractor Humphreys had ‘denied ever having sexual activity’ with either of the males when he was interviewed about the allegations in 2016 and 2017.
The New Statesman Podcast – Westminster Reimagined with Armando Iannucci
Part three: Centrism
This link should take you to the bonus 30 min podcast (with a few adverts) podcasts.google.com
The legendary writer, satirist and broadcaster Armando Iannucci joins the New StatesmanPodcast to co-host four special episodes. In these shows, Iannucci explores areas of British politics that he believes are broken, and is joined by guests from inside and outside the Westminster machine to discuss how politics could be better.
In episode three, Iannucci and Anoosh Chakelian examine political campaigning and centrism vs localism: whether better government comes from a powerful centre or from a strong local connection.
Iannucci and Chakelian are joined by special guests Chris Addison, Actor and Director who played special advisor Ollie Reeder in The Thick of It, and Claire Wright – the independent candidate who fought the East Devon constituency in three general elections – coming second each time. They discuss the conveyor belt from special advisor to politician and what you need to be a good MP.
The accounts from the Government’s Art Collection fund – which is reinforced with taxpayers’ money – show that Downing Street spent £70,200 on just one 24in by 28in painting by Irish artist Cathy Wilkes.
Another £18,775 was spent on a set of four black and white photographs by installation Irish artist Willie Doherty, according to a report from the Daily Mirror.
The two works were apparently purchased to honour the century that has passed since the establishment of Northern Ireland.
The news has arrived weeks after the government cut £20-a-week from universal credit and introduced a real-terms pay cut for teachers and police officers.
Downing Street claimed the “majority” of the cash for the artworks came from donors and refused to say how much money came from the public purse.
Unsurprisingly, opposition MPs and the public are less than happy about the news.
Labour MP Neil Coyle tweeted: “As his government cuts universal credit and freezes frontline nurse/police pay, Johnson has found more money to treat himself. Again.
“He could not be more out of touch.”
Labour MP Emma Lewell-Buck also told the Mirror: “The selfishness of the prime minister is galling.
“When shelves were bare in my local food banks, businesses have gone to the wall, public sector and key workers have suffered pay freezes and cuts, his priority is once again himself.”
One member of the public took to Twitter and asked: “How will these paintings benefit the taxpayer?”
Another said: “This is simply awful.”
A government spokesperson has defended the move, and said the Government Art Collection “acquires new works after consulting and securing the approval of an independent expert panel” and that the majority of the funding came from “philanthropic sources” not the taxpayer.
Conservative Lord Ed Vaizey of Didcot, former culture secretary, also jumped in to support the Prime Minister:
But, even this provoked some backlash online with one Twitter account writing: “That however, doesn’t make it right in these times and any committee should have stopped this in its tracks.”
David Cameron made $10m (£7.2m) from Greensill Capital before the financial firm collapsed, it has been revealed.
Documents seen by the BBC’s Panorama programme show the former Conservative prime minister cashed in $4.5 shares in 2019, was paid a $1m annual salary as a part-time “adviser”, and also got a $700,000 bonus.
The company left investors and UK taxpayers facing huge losses after collapsing.
Mr Cameron hit the headlines in relation to the bank after it emerged he was using his closeness to current cabinet ministers to try to persuade them to underwrite its loans with taxpayer cash.
He was unsuccessful in his approaches, though the bank was ultimately given access to another Covid-19 loan facility.
Mr Cameron has been cleared of breaking any lobbying rules over the affair, but MPs said he showed a “significant lack of judgement”.
Labour’s deputy leader Angela Rayner said: “It is utterly ludicrous that David Cameron walked away with $10m for two-and-a-half years’ part-time work for a company that collapsed, risking thousands of pounds of taxpayers’ money.
“The fact that David Cameron was cleared of any wrongdoing, proves that the rules that are supposed to regulate lobbying are completely unfit for purpose. It’s created a wild west where the Conservatives think it’s one rule for them and another for everyone else.”
She added: “The system causes more harm than good by giving a veil of legitimacy to the rampant cronyism, sleaze and dodgy lobbying that is polluting our democracy under Boris Johnson and the Conservatives.
“Labour will ban former prime ministers from ever taking on lobbying jobs after they leave office. We will overhaul the current broken system and replace it with an Integrity and Ethics Commission that will stamp out sleaze.
“This is money most of us cannot even imagine, but for David Cameron it was just a part time gig using his Tory contacts for huge personal gain.”
Mr Cameron’s spokesman said: “He acted in good faith at all times and there was no wrongdoing in any of the actions he took.”
He added that the former prime minister “did not receive anything like the figures quoted by Panorama”.